Fig. 7.
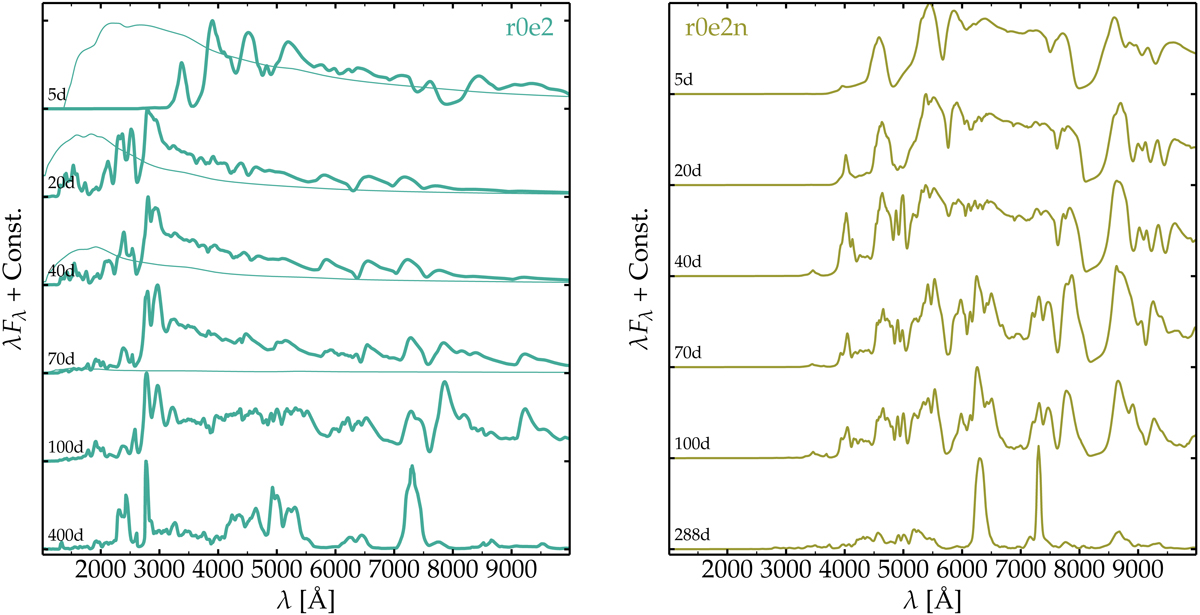
Multi-epoch spectra for model r0e2 (left panel) and model r0e2n (right panel). The quantity λFλ is shown to better reveal the fainter flux at longer wavelength. In the left panel, the thin line corresponds to the continuum flux (the offset with the full spectrum arises from the contribution from lines). What drives the difference in spectral and color properties between the two models is magnetar heating since the same ejecta (composition, mass, kinetic energy) is used for both (see discussion in Sect. 3).
Current usage metrics show cumulative count of Article Views (full-text article views including HTML views, PDF and ePub downloads, according to the available data) and Abstracts Views on Vision4Press platform.
Data correspond to usage on the plateform after 2015. The current usage metrics is available 48-96 hours after online publication and is updated daily on week days.
Initial download of the metrics may take a while.