Fig. 5.
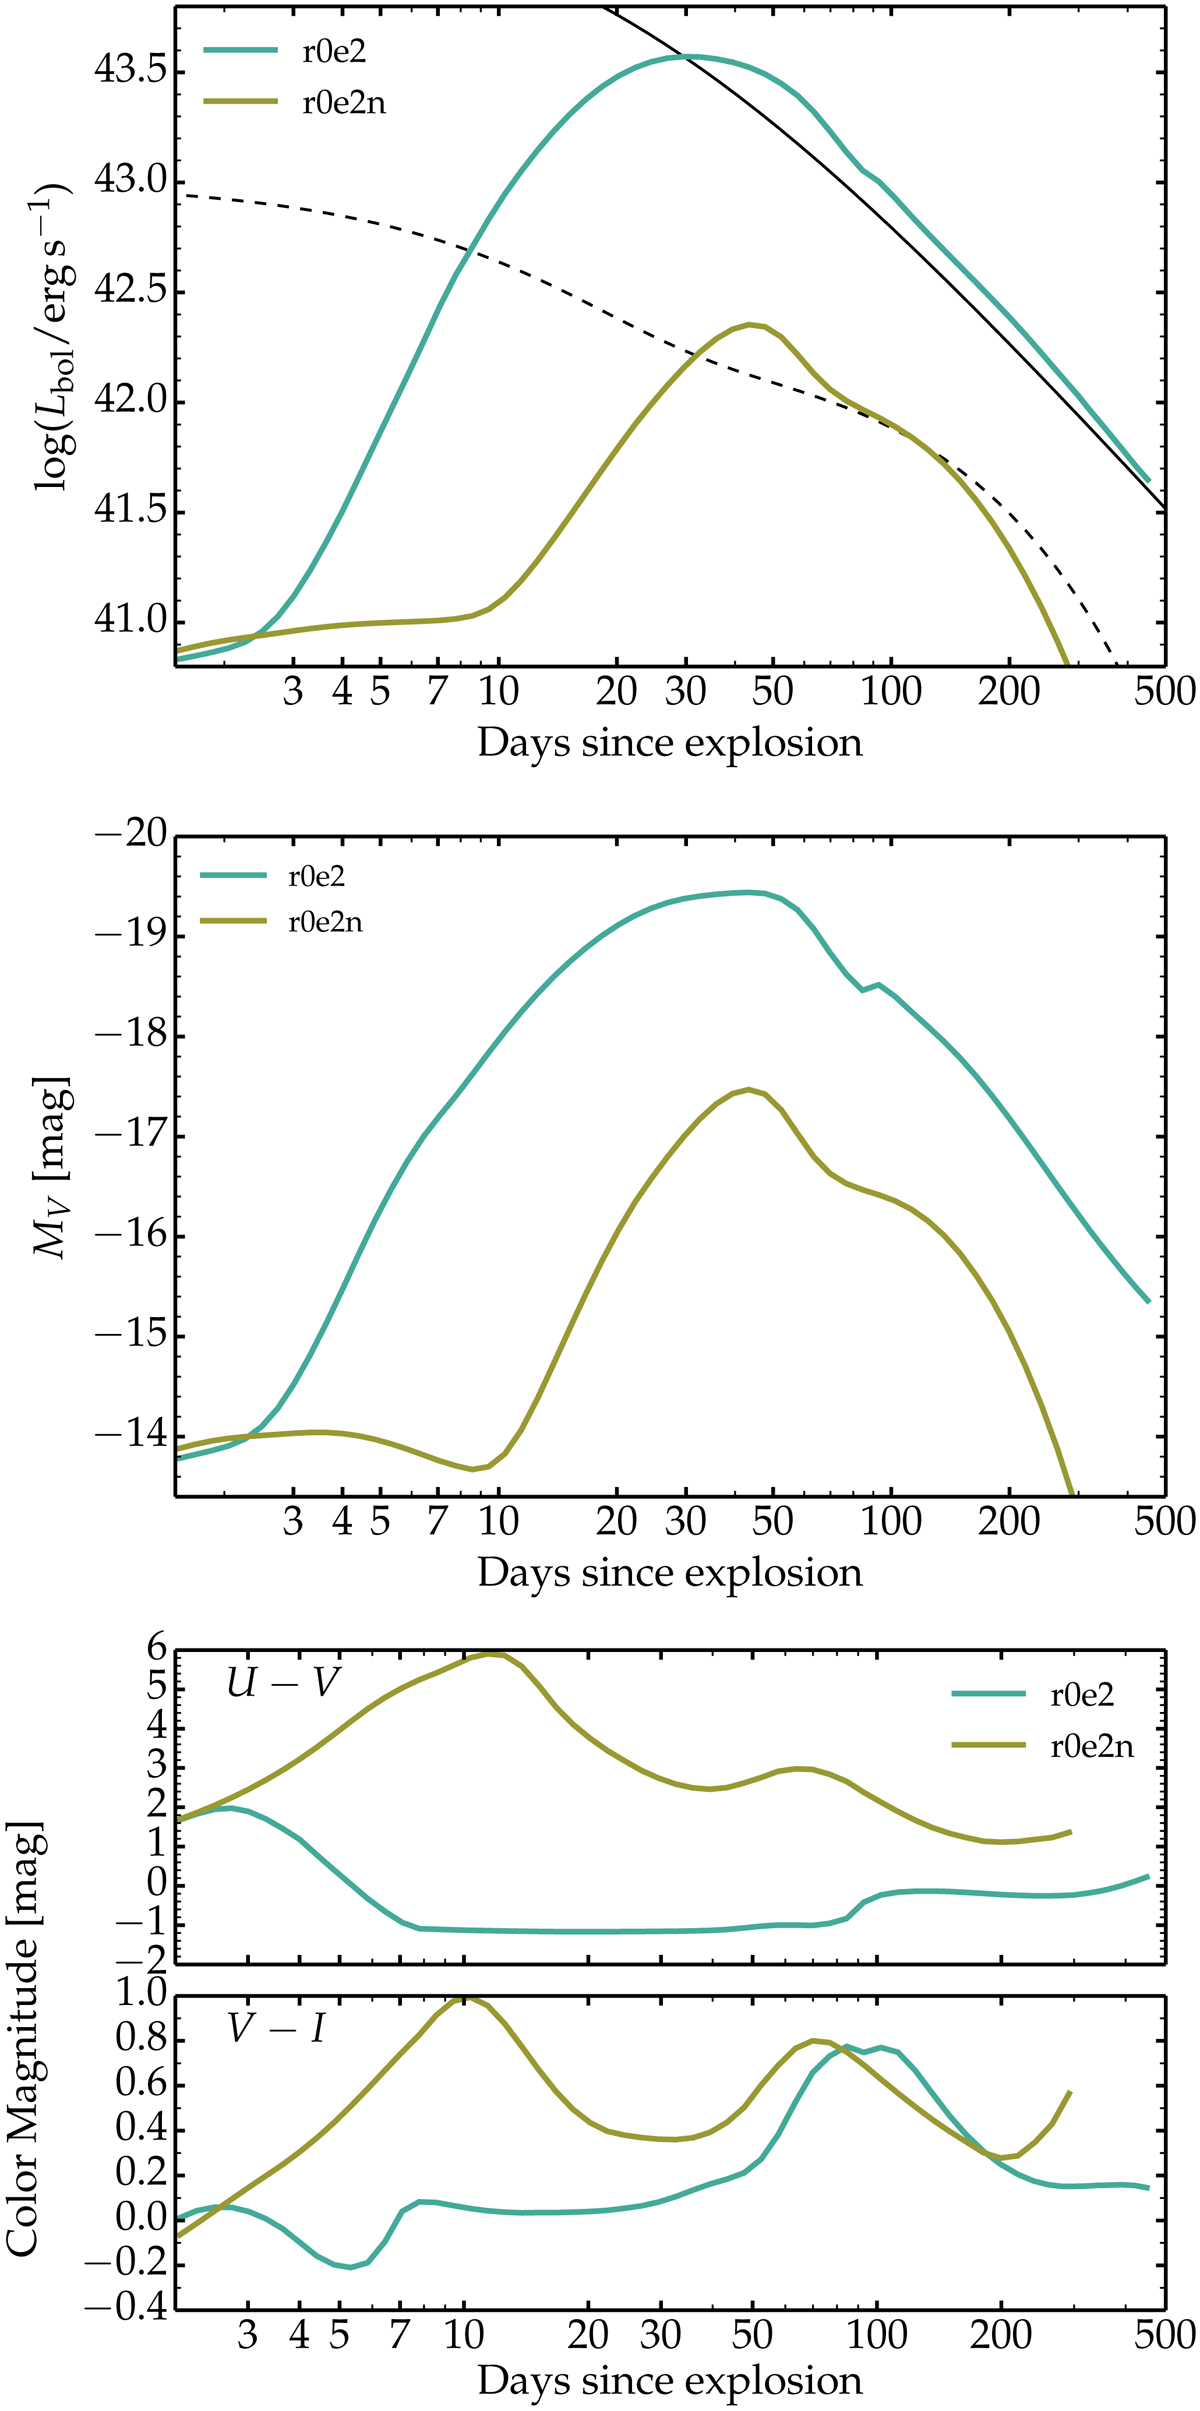
Bolometric light curve (top panel; overplotted are the absorbed power from the magnetar [solid black line] and from 56Ni decay [dashed black line]), V-band light curve (middle panel), and U − V and V − I color evolution (bottom panel) for models r0e2 and its unmagnetized counterpart r0e2n. The glitch at 90 d in the V-band light curve of model r0e2 corresponds to a rapid change in photospheric conditions (temperature and ionization), at a time when the ejecta optical depth is 5 − 10. The offset between Lbol and ėpm decreases with time in model r0e2 as the γ-rays from radioactive decay increasingly escape (the power from the magnetar is, by design, fully absorbed by the ejecta so the model eventually coasts to that value).
Current usage metrics show cumulative count of Article Views (full-text article views including HTML views, PDF and ePub downloads, according to the available data) and Abstracts Views on Vision4Press platform.
Data correspond to usage on the plateform after 2015. The current usage metrics is available 48-96 hours after online publication and is updated daily on week days.
Initial download of the metrics may take a while.