Fig. 28.
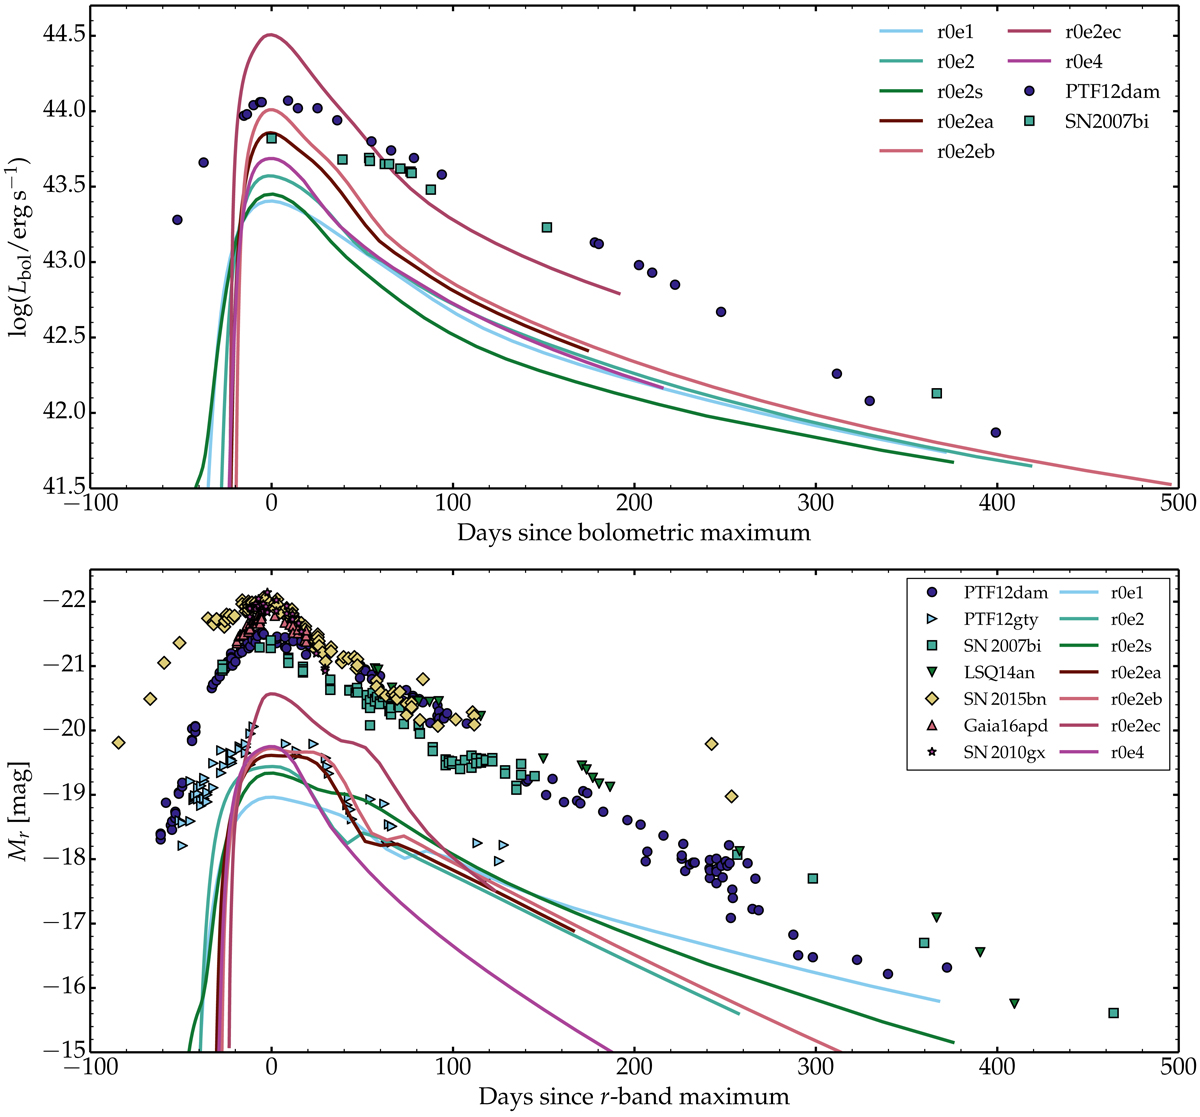
Top panel: comparison of the inferred bolometric light curves of PTF12dam and SN 2007bi (Chen et al. 2015) with a subset of models. Bottom panel: same as top, but for the r-band light curve. A sizable offset between the top and bottom panels can arise if the bolometric correction is large (as for model r0e2ec). Time dilation, reddening, and distance are corrected for.
Current usage metrics show cumulative count of Article Views (full-text article views including HTML views, PDF and ePub downloads, according to the available data) and Abstracts Views on Vision4Press platform.
Data correspond to usage on the plateform after 2015. The current usage metrics is available 48-96 hours after online publication and is updated daily on week days.
Initial download of the metrics may take a while.