Fig. 9.
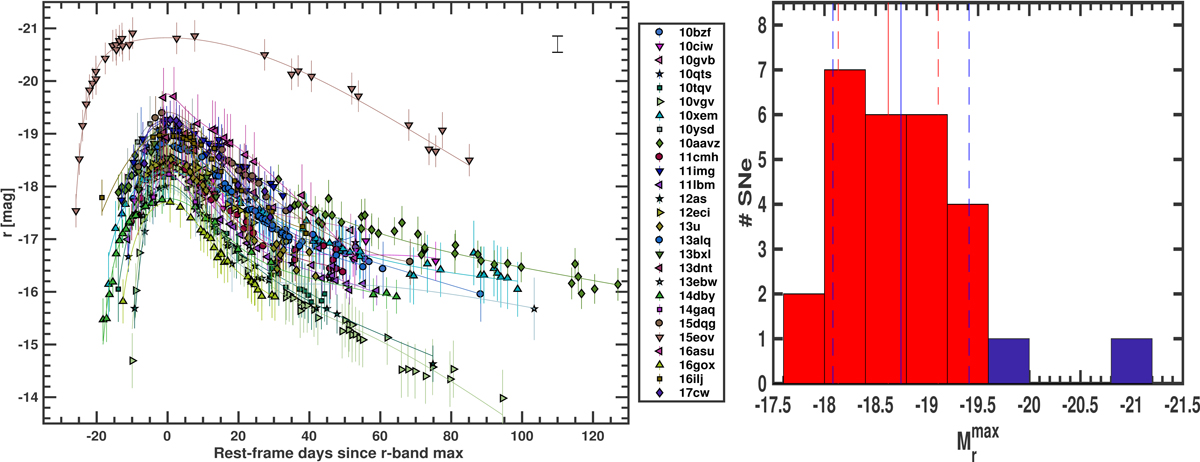
Left panel: absolute r-band magnitude light curves, after (host + MW) extinction correction and K-correction. The best fits are the same as those presented in Fig. 6. The systematic uncertainty in the distance is shown in the upper-right corner. Right panel: distribution of the absolute r peak magnitudes for our sample. iPTF15eov and iPTF16asu are marked in blue. Blue vertical lines indicate the average and the standard deviation of the distribution when including all of the objects. Red vertical lines mark the average and the standard deviation of the distribution when excluding iPTF15eov and iPTF16asu.
Current usage metrics show cumulative count of Article Views (full-text article views including HTML views, PDF and ePub downloads, according to the available data) and Abstracts Views on Vision4Press platform.
Data correspond to usage on the plateform after 2015. The current usage metrics is available 48-96 hours after online publication and is updated daily on week days.
Initial download of the metrics may take a while.