Fig. 8.
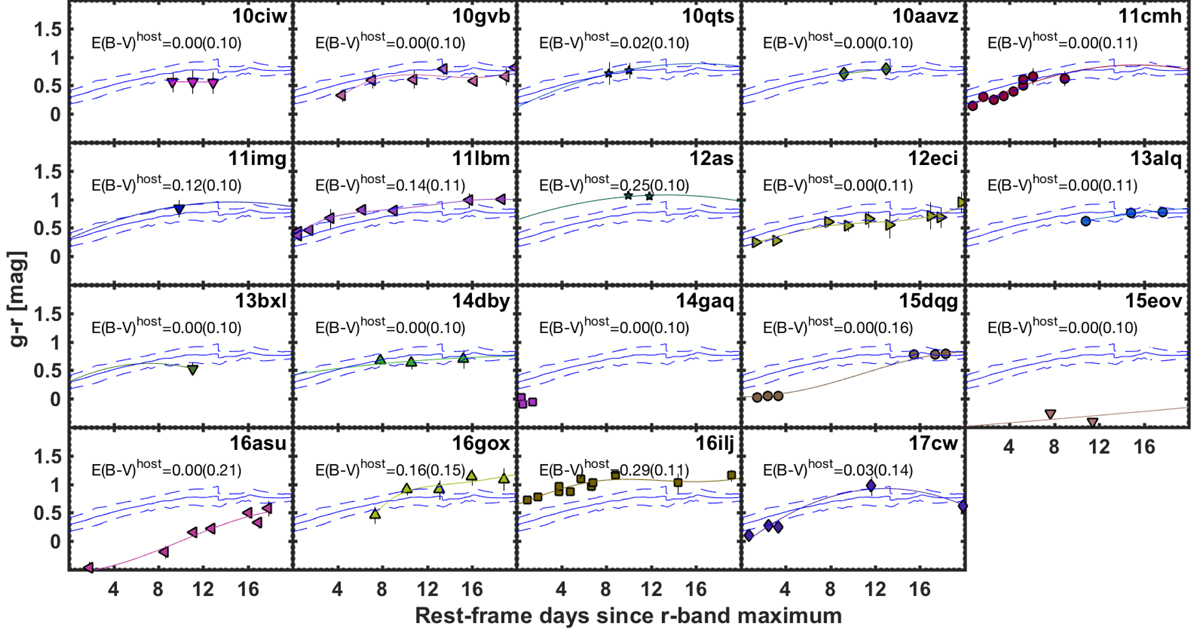
E(B − V)host from the g − r colors measured between 0 and 20 d after r-band peak brightness and corrected only for the MW extinction. The blue curves represent the intrinsic color and its uncertainty (obtained from the dereddened g − r colors of six SNe Ic-BL from the literature (see Prentice et al. 2016, their Fig. 10). Each SN color is fit with a low-order polynomial (colored curves with color matching the symbol color) in order to compare it to the intrinsic color and compute the average g − r color excess.
Current usage metrics show cumulative count of Article Views (full-text article views including HTML views, PDF and ePub downloads, according to the available data) and Abstracts Views on Vision4Press platform.
Data correspond to usage on the plateform after 2015. The current usage metrics is available 48-96 hours after online publication and is updated daily on week days.
Initial download of the metrics may take a while.