Free Access
Fig. 6.
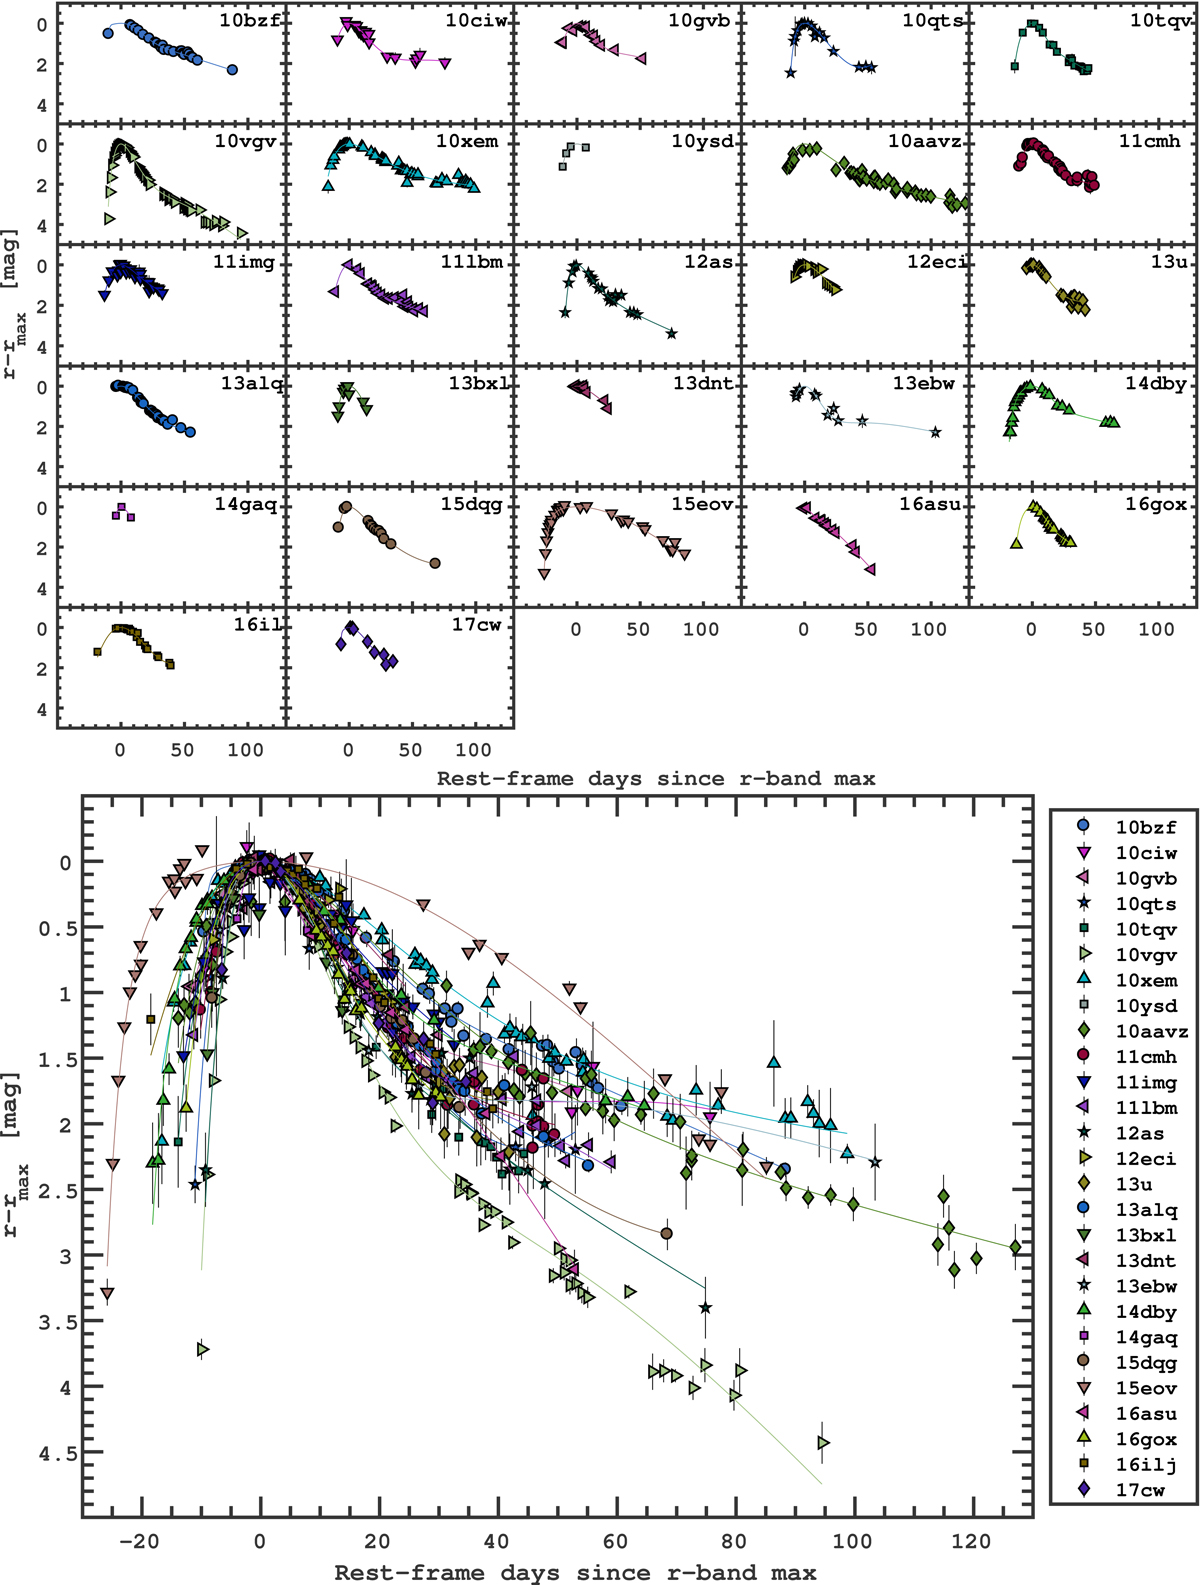
Top panel: rest-frame r-band light curves fit by the Contardo et al. (2000) equation. The best fits are shown as solid lines, and the light curves have been normalized to peak brightness. Bottom panel: same as in the top panel, but now all SNe were overplotted to highlight the variety of rise and decay timescales.
Current usage metrics show cumulative count of Article Views (full-text article views including HTML views, PDF and ePub downloads, according to the available data) and Abstracts Views on Vision4Press platform.
Data correspond to usage on the plateform after 2015. The current usage metrics is available 48-96 hours after online publication and is updated daily on week days.
Initial download of the metrics may take a while.