Fig. 4.
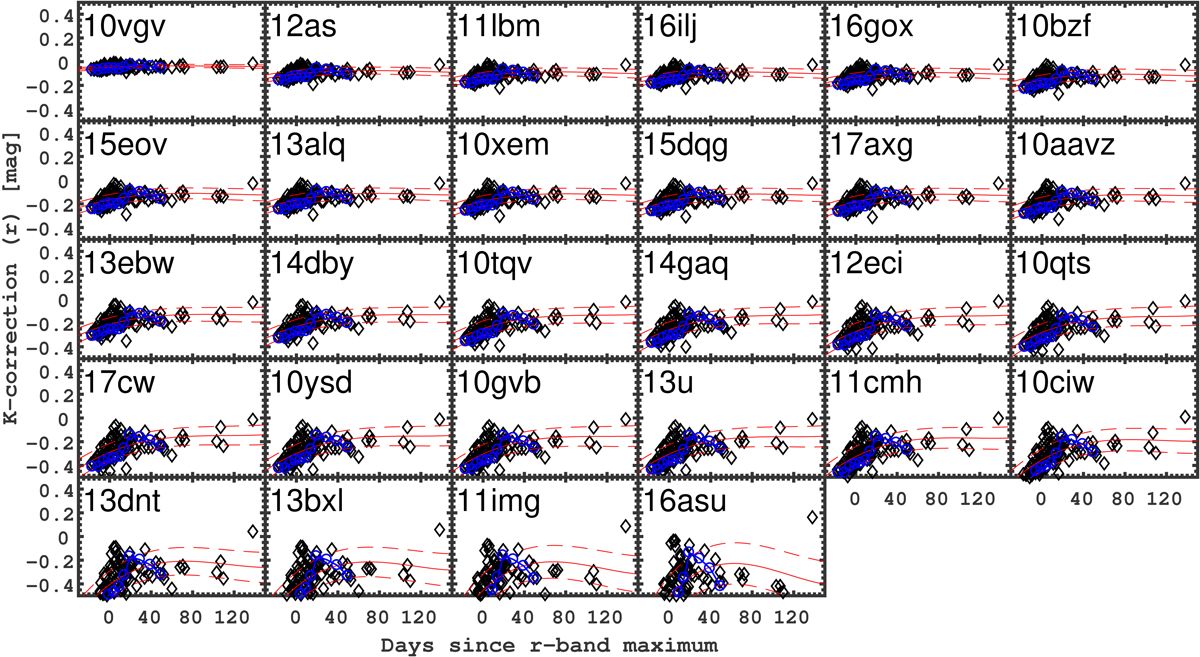
K-corrections in the r band for our SN sample. For each SN redshift we determined the ![]() from all the SN spectra in our sample, and we fit them with a second-order polynomial, shown as a solid red line. The 1σ uncertainties are shown as red dashed lines. The SNe are ordered based on redshift, with the nearest ones on top. For the most distant events, K-corrections in r have values up to 0.4 mag around peak. For comparison, in blue we show the K-corrections from the SN Ic-BL spectral templates available at Peter Nugent’s Spectral Templates webpage. The results are similar and compatible within the uncertainties.
from all the SN spectra in our sample, and we fit them with a second-order polynomial, shown as a solid red line. The 1σ uncertainties are shown as red dashed lines. The SNe are ordered based on redshift, with the nearest ones on top. For the most distant events, K-corrections in r have values up to 0.4 mag around peak. For comparison, in blue we show the K-corrections from the SN Ic-BL spectral templates available at Peter Nugent’s Spectral Templates webpage. The results are similar and compatible within the uncertainties.
Current usage metrics show cumulative count of Article Views (full-text article views including HTML views, PDF and ePub downloads, according to the available data) and Abstracts Views on Vision4Press platform.
Data correspond to usage on the plateform after 2015. The current usage metrics is available 48-96 hours after online publication and is updated daily on week days.
Initial download of the metrics may take a while.