Fig. 3.
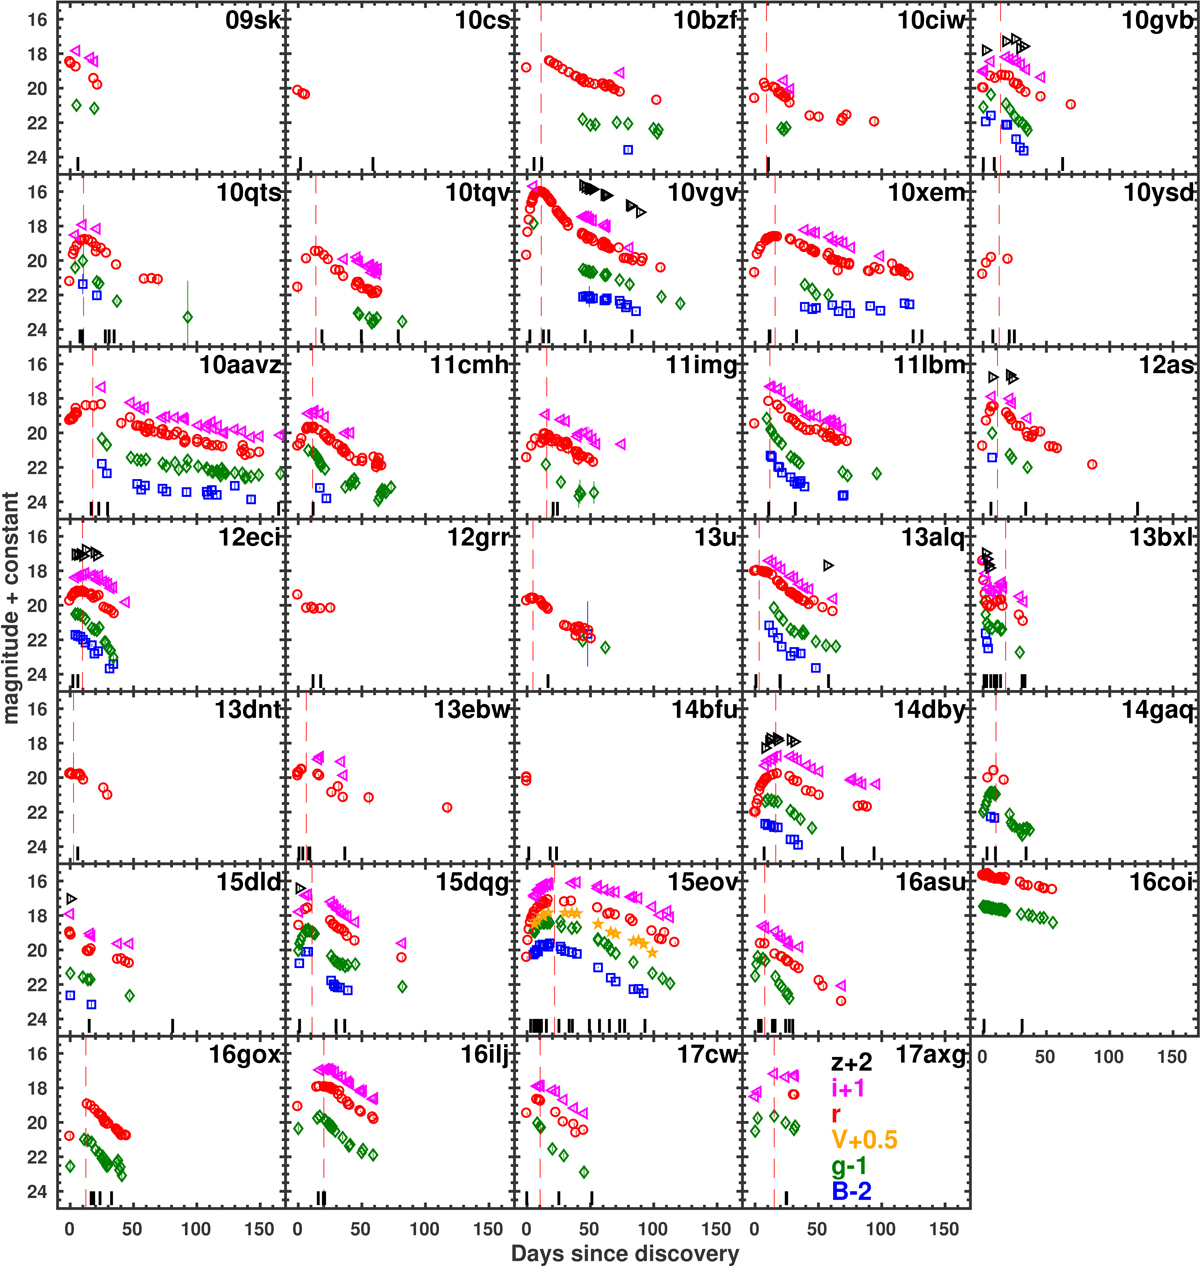
B (blue squares), g (green diamonds), r (red circles), i (magenta triangles), and z (black triangles) photometry for our sample of SNe Ic-BL. In the case of iPTF15eov we also have a V-band light curve (yellow stars). The light curves as a function of discovery epoch have been shifted for clarity (see the legend in the last subpanel). The epochs of the observed r-band maxima are marked by vertical red dashed lines. The spectral epochs are shown by black segments at the bottom of each subpanel.
Current usage metrics show cumulative count of Article Views (full-text article views including HTML views, PDF and ePub downloads, according to the available data) and Abstracts Views on Vision4Press platform.
Data correspond to usage on the plateform after 2015. The current usage metrics is available 48-96 hours after online publication and is updated daily on week days.
Initial download of the metrics may take a while.