Fig. 27.
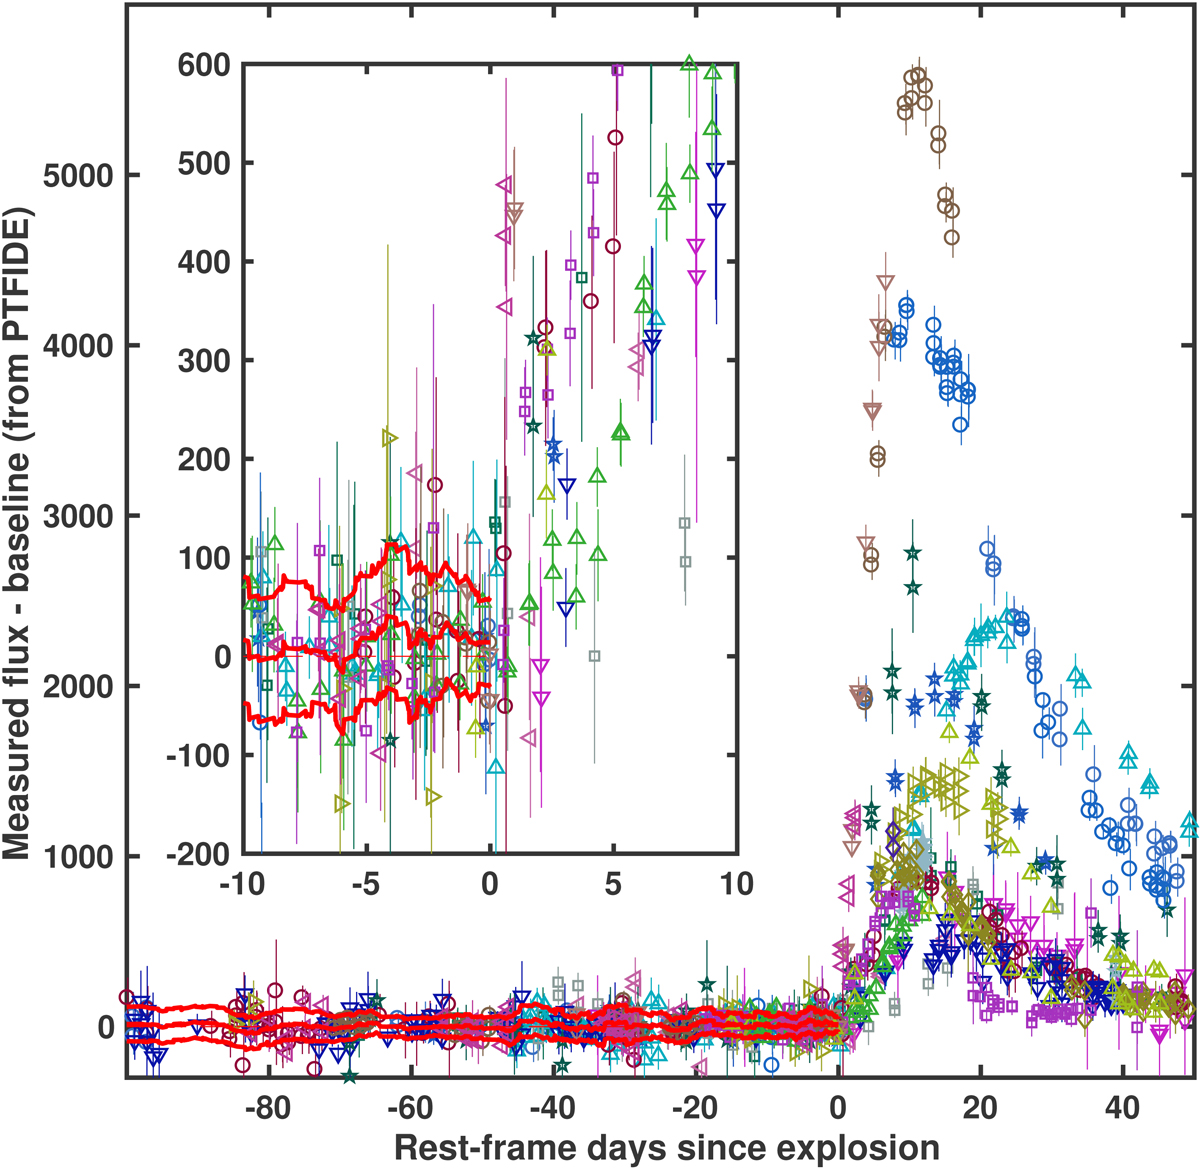
Observed r-band (g-band in the cases of iPTF14gaq, iPTF15dqg, iPTF16asu, and iPTF16gox) fluxes from PTFIDE minus the zero-flux level (baseline) as a function of time since explosion for all of the SNe with derived explosion epoch and data available a few days before explosion. The inset gives a close-up view of the time range between −10 and +10 d. No pre-rise excess is observed between −10 and +0 d. Colors and symbols as in Fig. 21. A moving mean over 20 points and its enveloping standard deviations are marked by thick solid red lines, and it is consistent with zero flux.
Current usage metrics show cumulative count of Article Views (full-text article views including HTML views, PDF and ePub downloads, according to the available data) and Abstracts Views on Vision4Press platform.
Data correspond to usage on the plateform after 2015. The current usage metrics is available 48-96 hours after online publication and is updated daily on week days.
Initial download of the metrics may take a while.