Fig. 20.
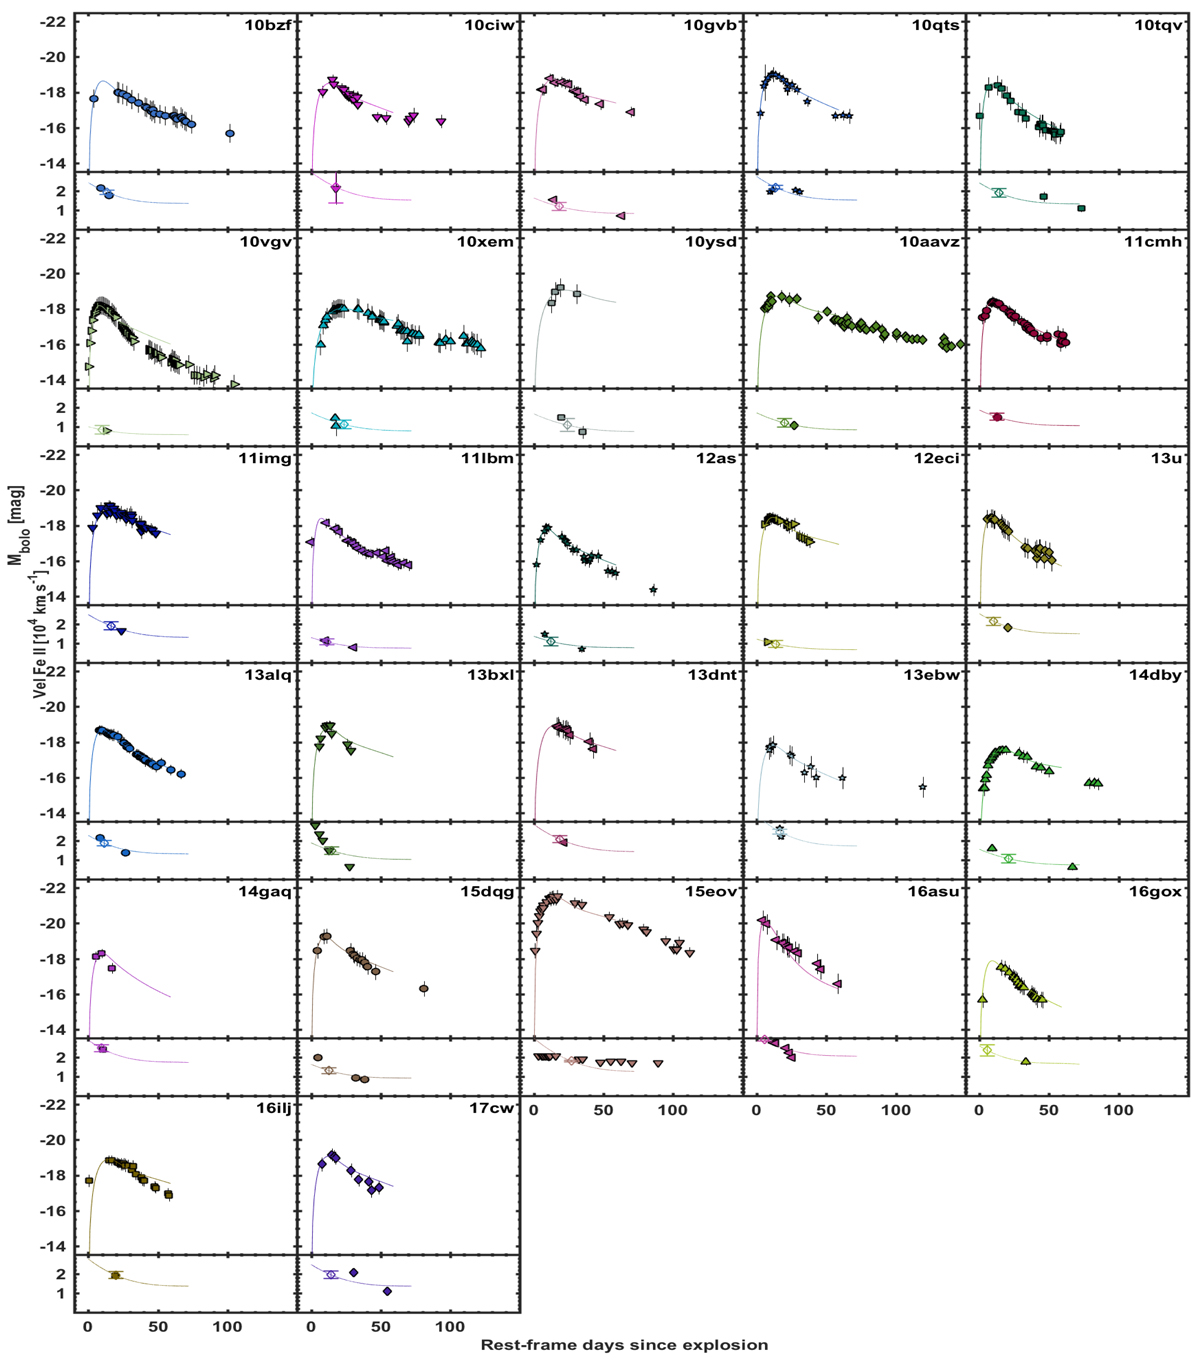
Bolometric light curves and velocity profiles for our sample. For the SNe without velocity measurements, we assumed the average velocity profile. The bolometric light curves were fit with the Arnett model, shown as a solid line. The velocity profiles were fit with a scaled polynomial that also reproduces the velocity profile of the SN Ic spectral templates provided by Modjaz et al. (2016), and it is shown with solid lines in the velocity subpanels. The velocity at peak brightness is marked with an empty diamond.
Current usage metrics show cumulative count of Article Views (full-text article views including HTML views, PDF and ePub downloads, according to the available data) and Abstracts Views on Vision4Press platform.
Data correspond to usage on the plateform after 2015. The current usage metrics is available 48-96 hours after online publication and is updated daily on week days.
Initial download of the metrics may take a while.