Fig. 16.
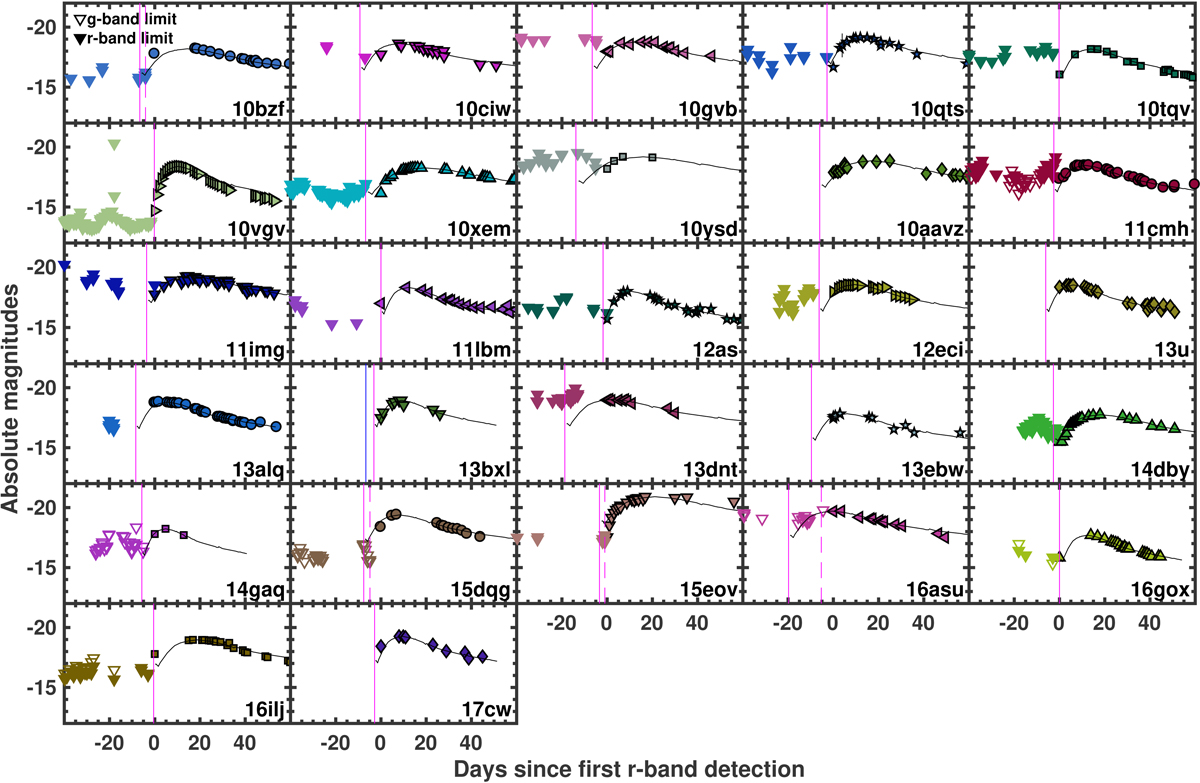
Fits of the r light curves of our SNe Ic-BL with the stretched light curve of SN 1998bw (black solid line). This fitting aims at determining the explosion epoch, marked by a vertical magenta line. The pre-explosion limits, marked by empty (g-band) and filled (r-band) triangles, are in agreement with the computed explosion epochs, except in four cases where we instead adopt the last nondetection as the explosion epoch and a value from the literature for iPTF16asu (magenta dashed lines). For iPTF13bxl, we adopt the time of the detected GRB as the explosion epoch (blue vertical line).
Current usage metrics show cumulative count of Article Views (full-text article views including HTML views, PDF and ePub downloads, according to the available data) and Abstracts Views on Vision4Press platform.
Data correspond to usage on the plateform after 2015. The current usage metrics is available 48-96 hours after online publication and is updated daily on week days.
Initial download of the metrics may take a while.