Free Access
Fig. 12.
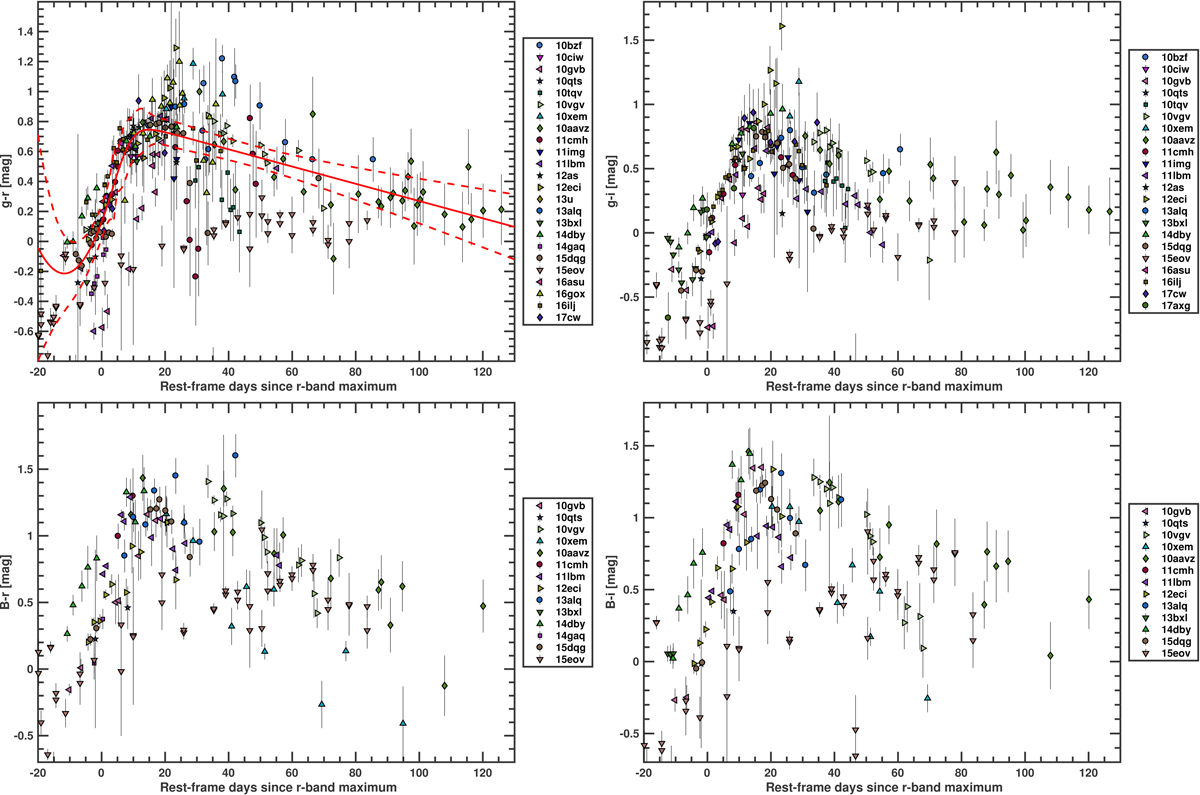
g − r, g − i, B − r, and B − i color evolution for our SNe Ic-BL. The g − r color is fit with the expression used by Burns et al. (2014) and Stritzinger et al. (2018), and the best fit with its 3σ uncertainties is shown by red lines. All of the colors are MW and host-galaxy extinction corrected.
Current usage metrics show cumulative count of Article Views (full-text article views including HTML views, PDF and ePub downloads, according to the available data) and Abstracts Views on Vision4Press platform.
Data correspond to usage on the plateform after 2015. The current usage metrics is available 48-96 hours after online publication and is updated daily on week days.
Initial download of the metrics may take a while.