Fig. 7
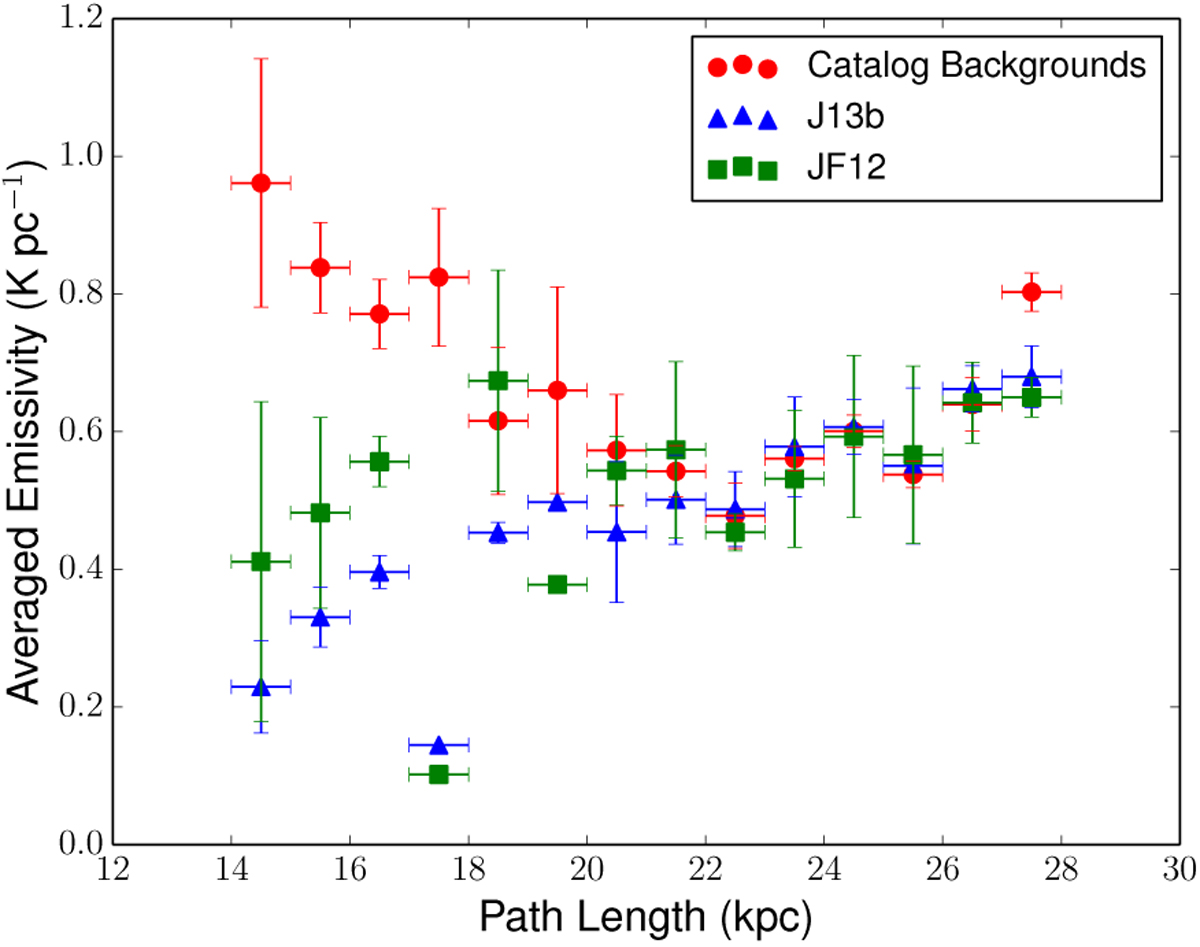
Simulated data from the GMF-based emissivity models with the observed emissivities from the catalog. All data are averaged over bins of 1 Kpc width, as indicated by the horizontal error bars. For the model data, the vertical error bars indicate the variance in the binned data. A lack of vertical error bar indicates the presence of only one data point in the bin. Shown is the synchrotron emissivity (y-axis) as a functionof the path length for each HII region (x-axis). The simulated data shown here is normalized with respect to the longer path lengths (>18 Kpc).
Current usage metrics show cumulative count of Article Views (full-text article views including HTML views, PDF and ePub downloads, according to the available data) and Abstracts Views on Vision4Press platform.
Data correspond to usage on the plateform after 2015. The current usage metrics is available 48-96 hours after online publication and is updated daily on week days.
Initial download of the metrics may take a while.