Free Access
Fig. 5
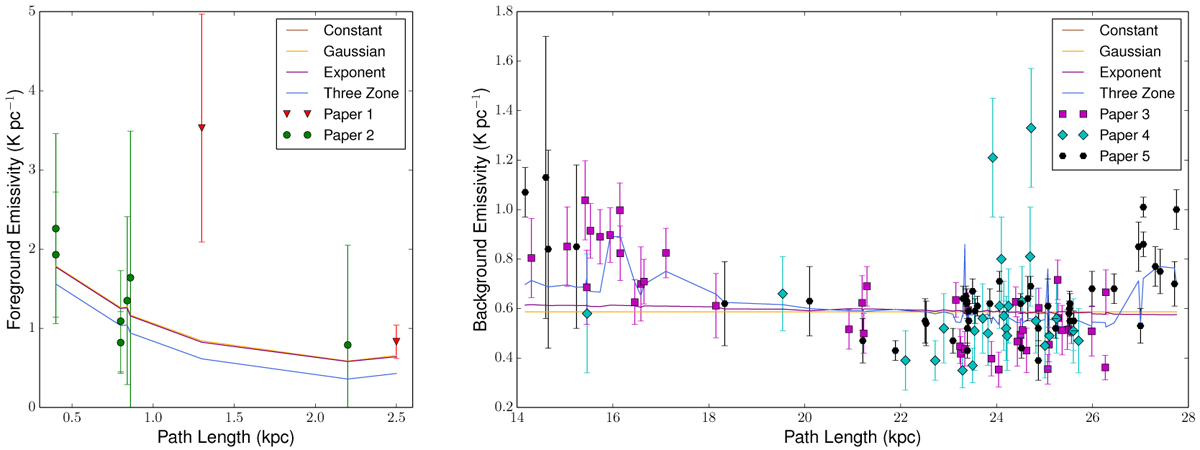
Left panel: observed foreground emissivities (ϵF) as a function of the path length for papers 1and 2. Right panel: same, but for the observed background emissivities (ϵB) from Papers3–5. In both plots the simulated emissivities for the simple models are shown. In Sect. 7 we discuss the results of the modeling in detail.
Current usage metrics show cumulative count of Article Views (full-text article views including HTML views, PDF and ePub downloads, according to the available data) and Abstracts Views on Vision4Press platform.
Data correspond to usage on the plateform after 2015. The current usage metrics is available 48-96 hours after online publication and is updated daily on week days.
Initial download of the metrics may take a while.