Fig. 1
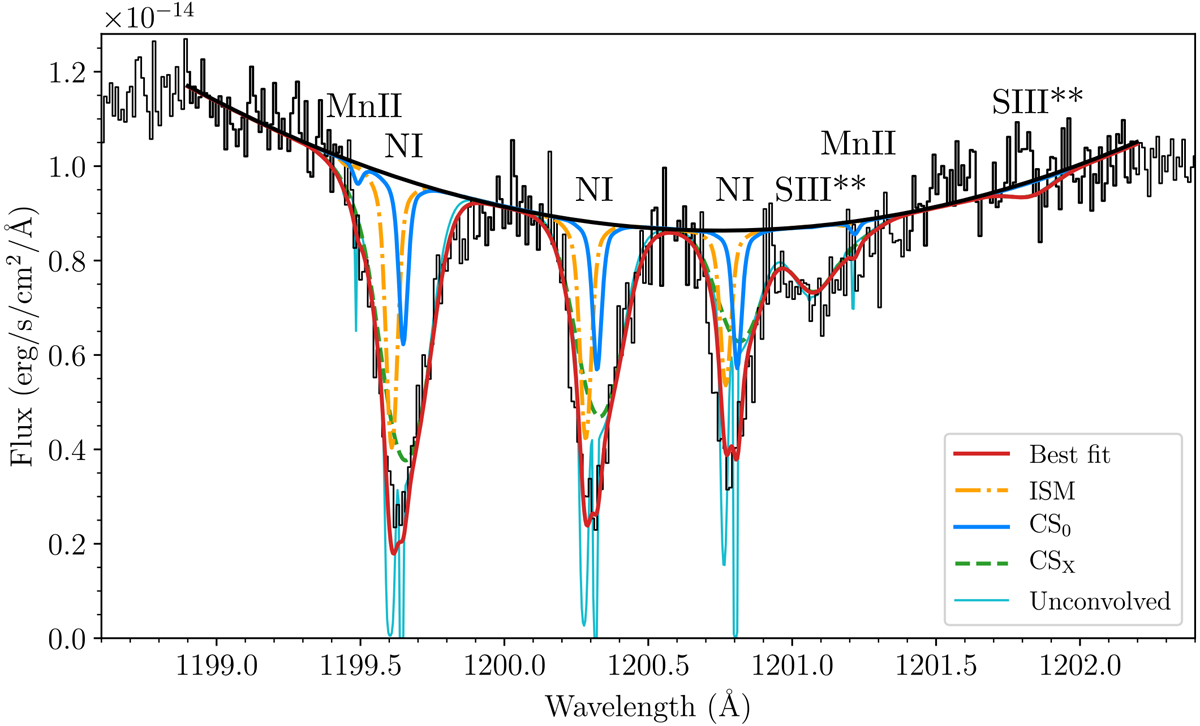
Measured flux as a function of wavelength (HST rest frame) for the NI lines at ~ 1200Å. The black spectrum represents the combined data, and the thicker parts indicate the region we used to fit the continuum, which is shown as a black solid line. The coloured lines show the individual components. The cyan line shows the individual absorption profiles before they were convolved by the instrumental LSF.
Current usage metrics show cumulative count of Article Views (full-text article views including HTML views, PDF and ePub downloads, according to the available data) and Abstracts Views on Vision4Press platform.
Data correspond to usage on the plateform after 2015. The current usage metrics is available 48-96 hours after online publication and is updated daily on week days.
Initial download of the metrics may take a while.