Fig. 3
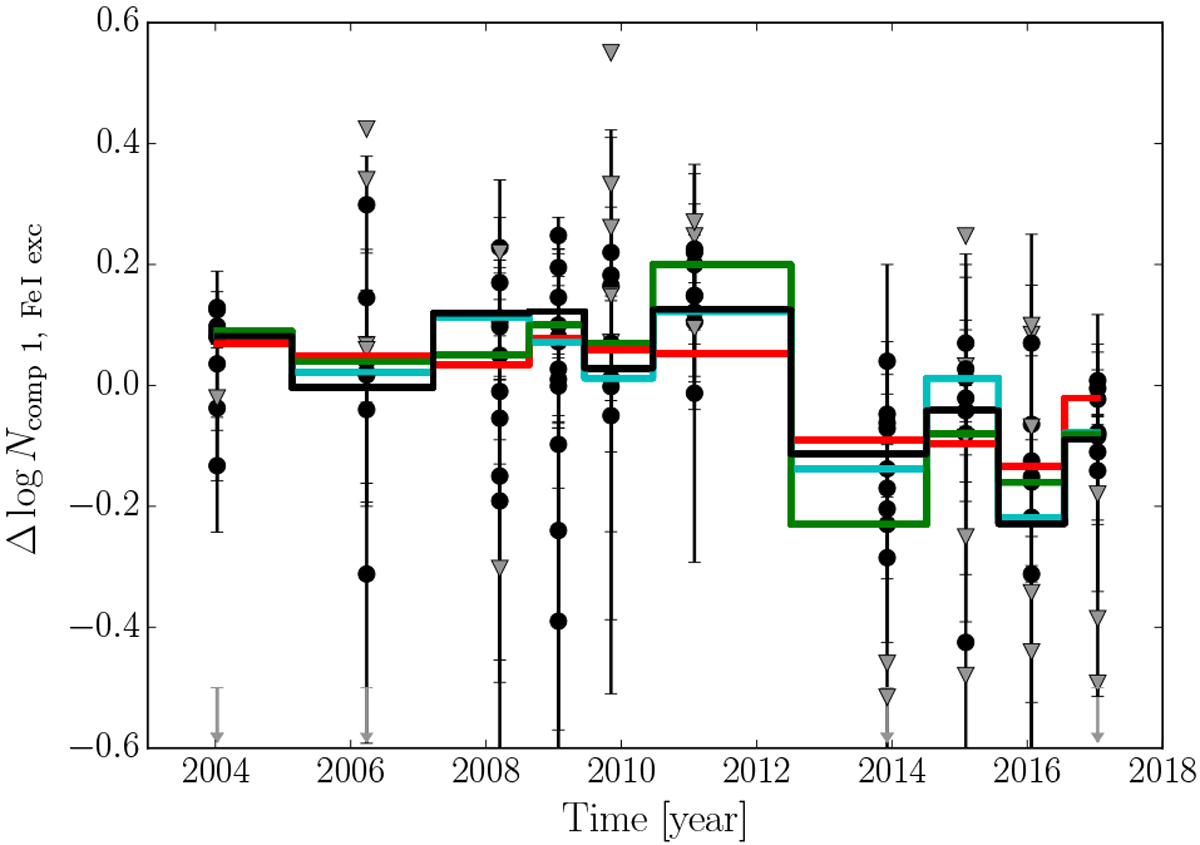
Spread and evolution of the (log) Fe I column density among the 12 excited levels over time. The black circles refer to the column density of each excited level relative to its median value as observed from 2003 to 2017. The grey triangles are upper limits derived from weaker absorptions. A few points outside the plot window are shown with arrows next to the axis. The solid black line shows how the total column density of excited Fe I varies over time. The cyan and green solid lines show the evolution of the column densities derived, respectively, for the Fe I416 and Fe I6928 excited levels. The Fe I0 variations derived in Table 4 are shown as a solid red line.
Current usage metrics show cumulative count of Article Views (full-text article views including HTML views, PDF and ePub downloads, according to the available data) and Abstracts Views on Vision4Press platform.
Data correspond to usage on the plateform after 2015. The current usage metrics is available 48-96 hours after online publication and is updated daily on week days.
Initial download of the metrics may take a while.