Free Access
Fig. 7.
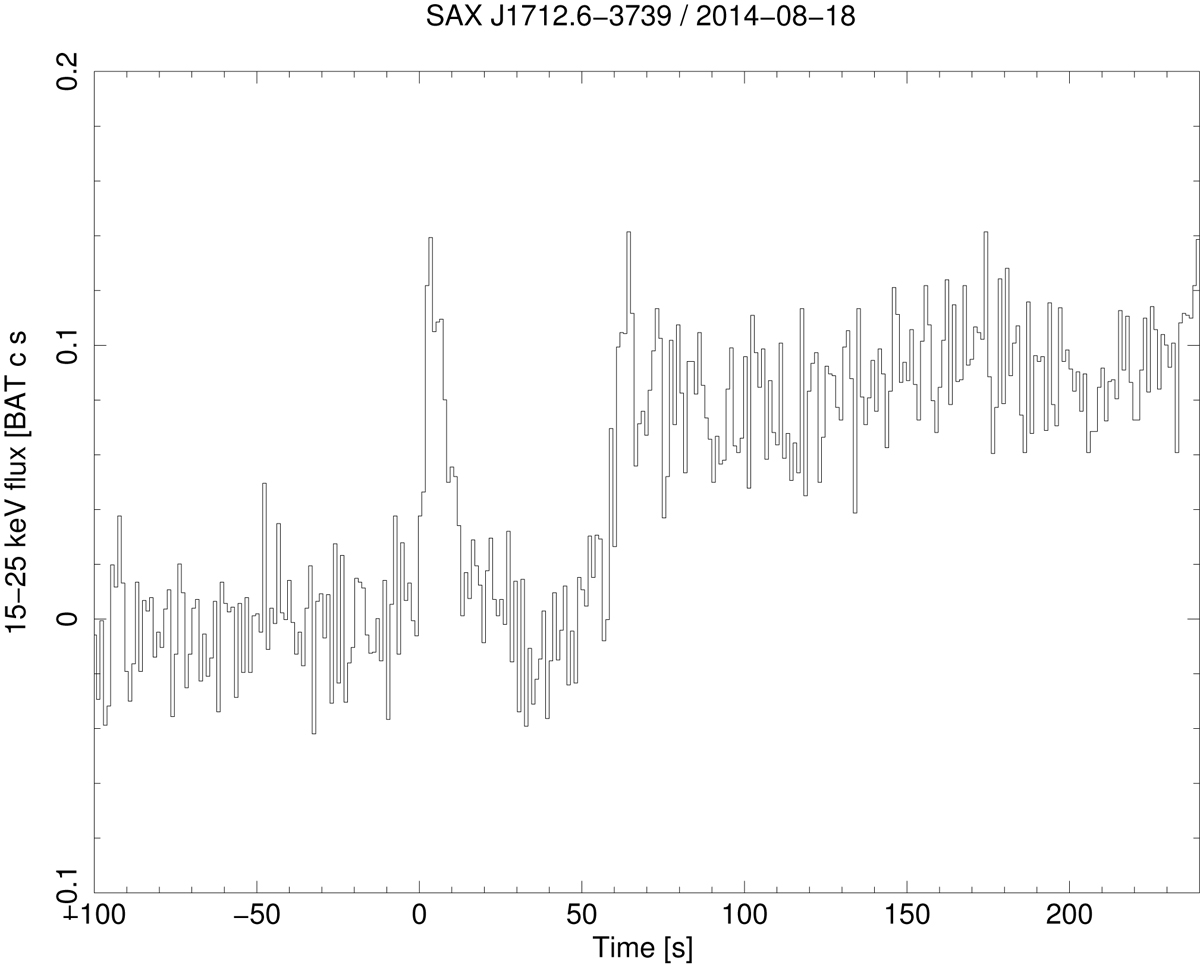
BAT light curve of the third burst from SAX J1712.6–3739, reconstructed from rate meter data in 15–25 keV (pre-burst flux subtracted between −40 and 0 s from burst start and normalized to projected detector area as seen from source). During this data stretch BAT had a fixed pointing.
Current usage metrics show cumulative count of Article Views (full-text article views including HTML views, PDF and ePub downloads, according to the available data) and Abstracts Views on Vision4Press platform.
Data correspond to usage on the plateform after 2015. The current usage metrics is available 48-96 hours after online publication and is updated daily on week days.
Initial download of the metrics may take a while.