Fig. 5.
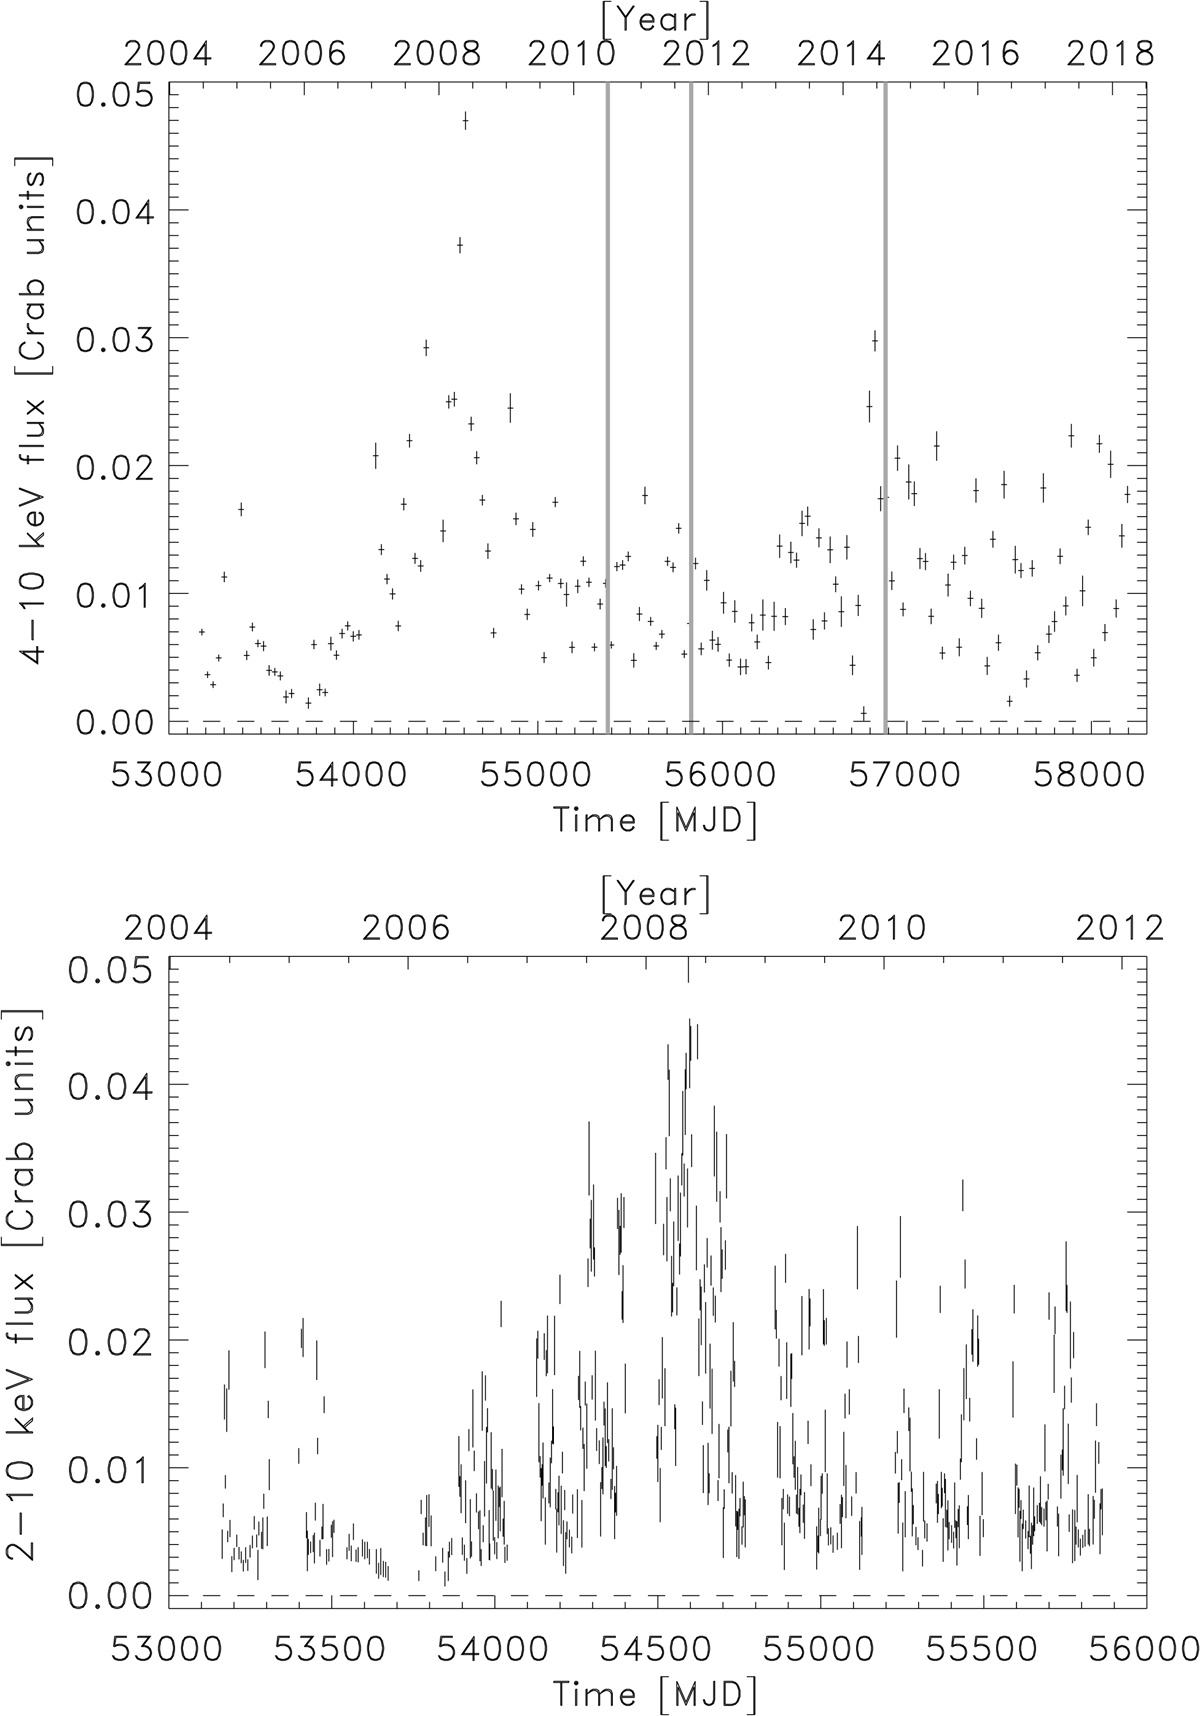
Top panel: 4–10 keV light curve over 14 years for SAX J1712.6–3739 with a time resolution of 1 month. The data are from the PCA Bulge Scan program (Swank & Markwardt 2001) between 2004 and 2012, and MAXI observations between 2009 and 2018 (e.g., Negoro et al. 2016). A cross calibration has been performed for the two years that the programs overlap. Strong variability is obvious. Vertical bars indicate the times of the three bursts detected with Swift. Bottom panel: 2–10 keV light curve measurements with PCA over 8 years for SAX J1712.6–3739. Typically, each data point represents 1 min of data and measurements were performed twice a week. Strong variability is also obvious at this resolution.
Current usage metrics show cumulative count of Article Views (full-text article views including HTML views, PDF and ePub downloads, according to the available data) and Abstracts Views on Vision4Press platform.
Data correspond to usage on the plateform after 2015. The current usage metrics is available 48-96 hours after online publication and is updated daily on week days.
Initial download of the metrics may take a while.