Free Access
Fig. 3.
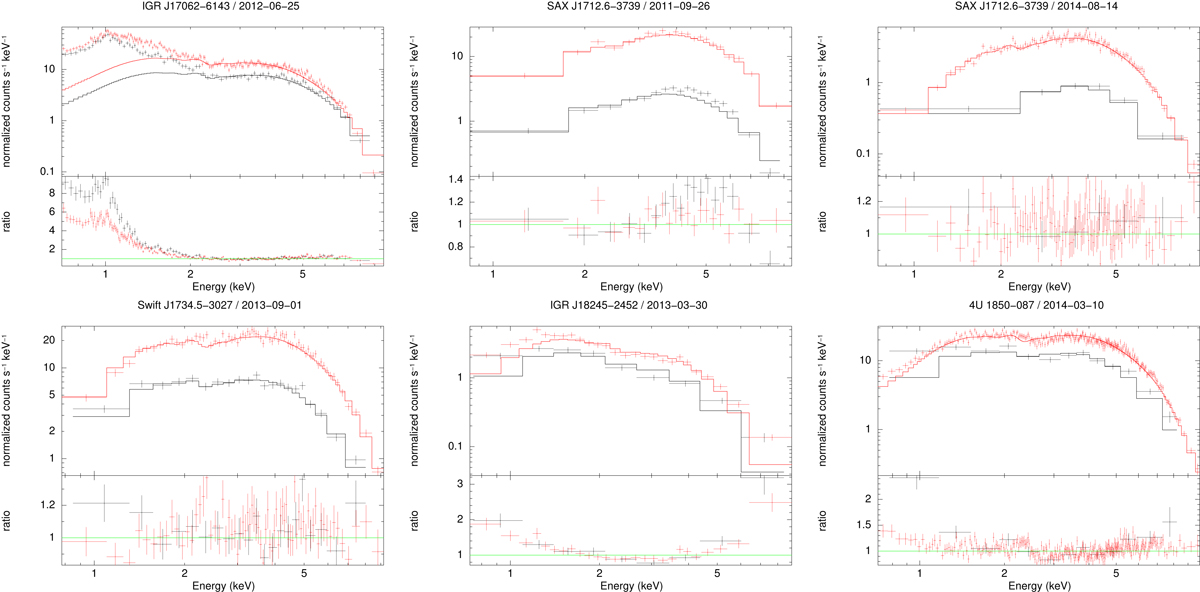
Spectra of the upward and downward fluctuations for the six selected bursts. For IGR J17062–6143, only data above 2 keV were fitted. The lower panels show the ratio of the data to the applied model. Black data points are for “lo” data, red for the “hi”.
Current usage metrics show cumulative count of Article Views (full-text article views including HTML views, PDF and ePub downloads, according to the available data) and Abstracts Views on Vision4Press platform.
Data correspond to usage on the plateform after 2015. The current usage metrics is available 48-96 hours after online publication and is updated daily on week days.
Initial download of the metrics may take a while.