Free Access
Fig. 2.
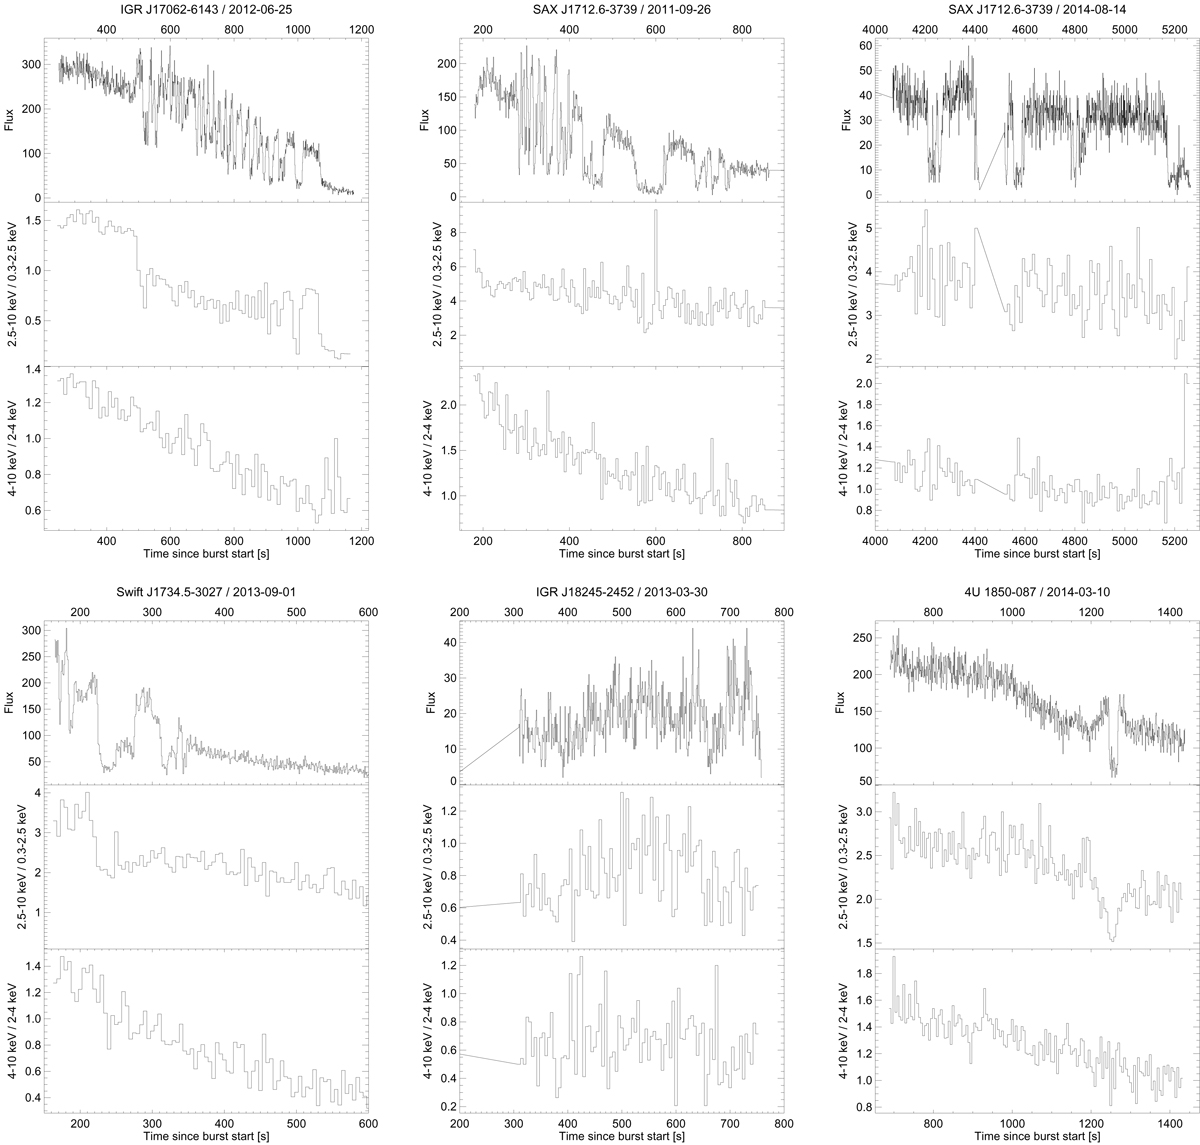
Time profiles of the XRT data of the six selected bursts: of the intensity (top panels), the 2.5–10 keV/0.25–2.5 keV hardness ratio (middle panels) and the 4–10 keV/2–4 keV hardness ratio (bottom panels). Times are since burst onset as determined from BAT data.
Current usage metrics show cumulative count of Article Views (full-text article views including HTML views, PDF and ePub downloads, according to the available data) and Abstracts Views on Vision4Press platform.
Data correspond to usage on the plateform after 2015. The current usage metrics is available 48-96 hours after online publication and is updated daily on week days.
Initial download of the metrics may take a while.