Fig. A.1.
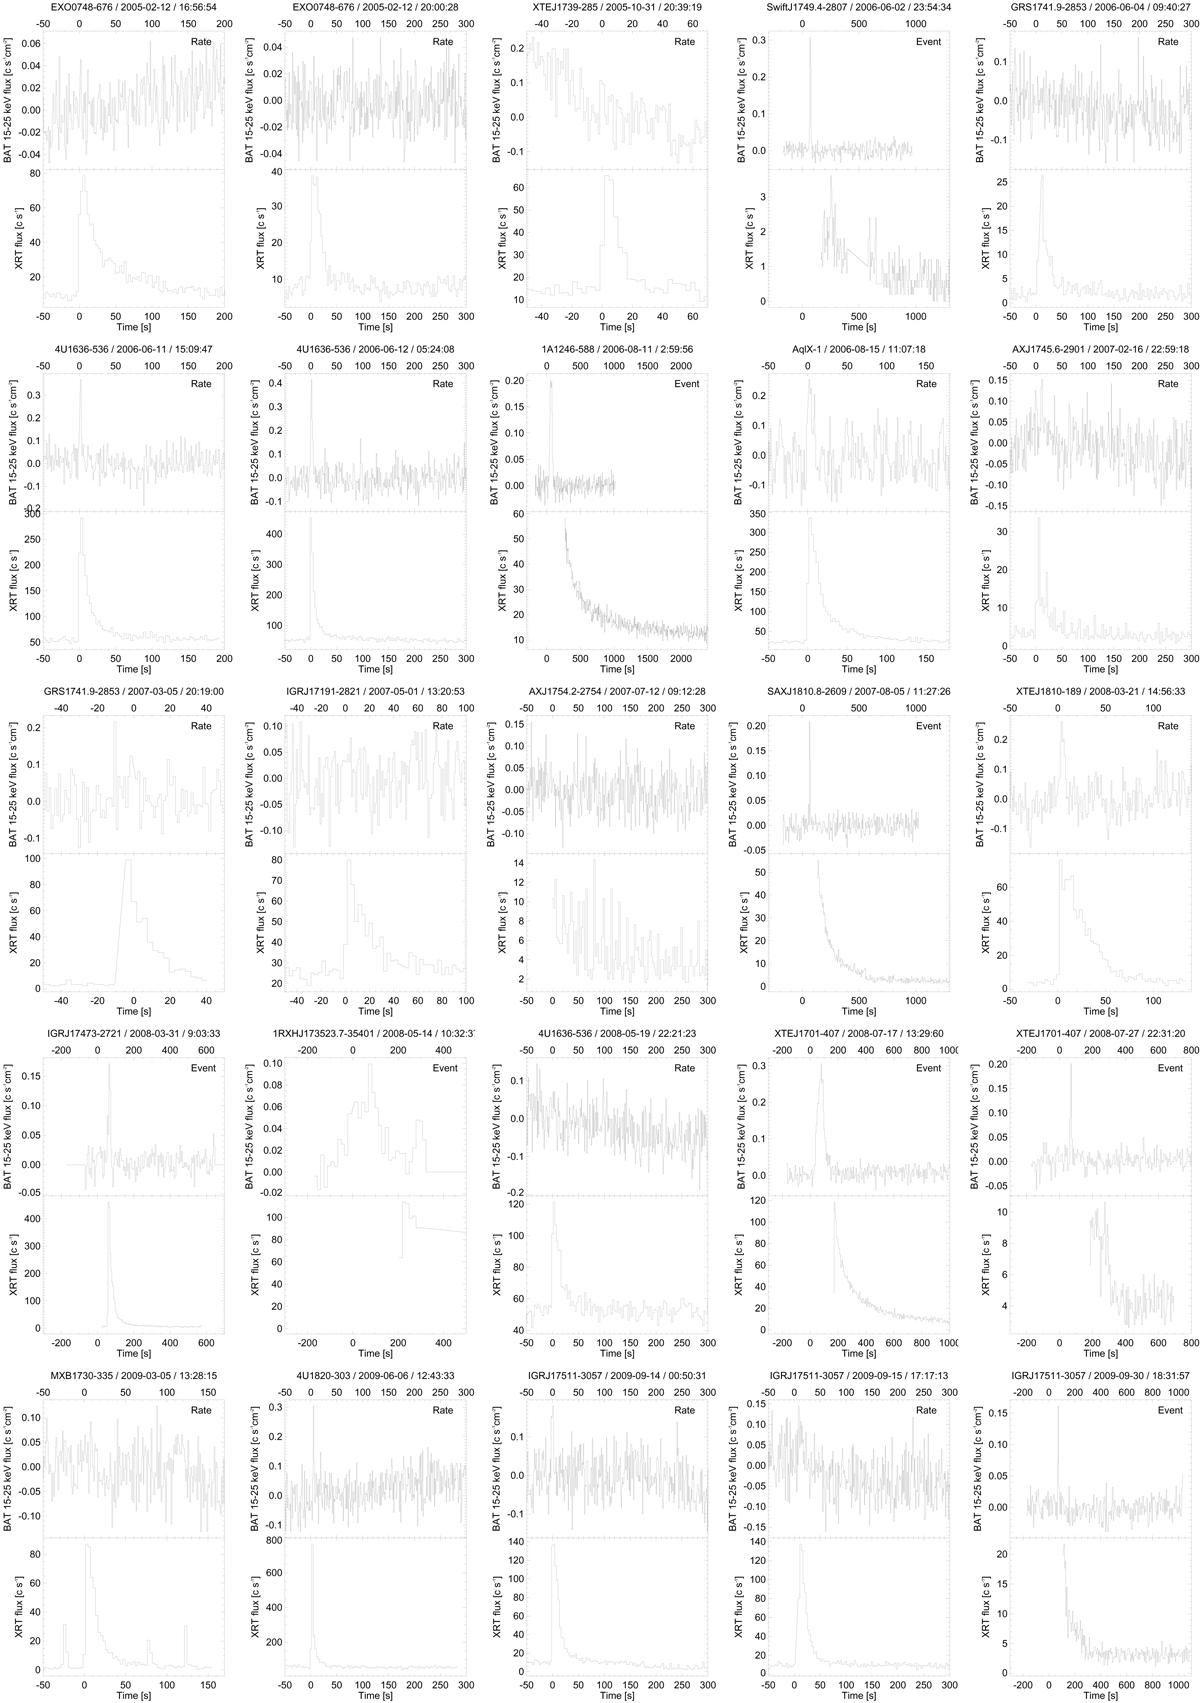
BAT (upper panels) and XRT light curves (lower panels) of all 90 X-ray bursts that have XRT coverage. The BAT light curves are labeled “Event” if they are from mask-tagged event data or “Rate” if they are inferred from rate meter data. In the latter case, the rate meter data have been pre-burst subtracted and divided by the photon-collecting area illuminated by the source that was identified on board.
Current usage metrics show cumulative count of Article Views (full-text article views including HTML views, PDF and ePub downloads, according to the available data) and Abstracts Views on Vision4Press platform.
Data correspond to usage on the plateform after 2015. The current usage metrics is available 48-96 hours after online publication and is updated daily on week days.
Initial download of the metrics may take a while.