Fig. 6.
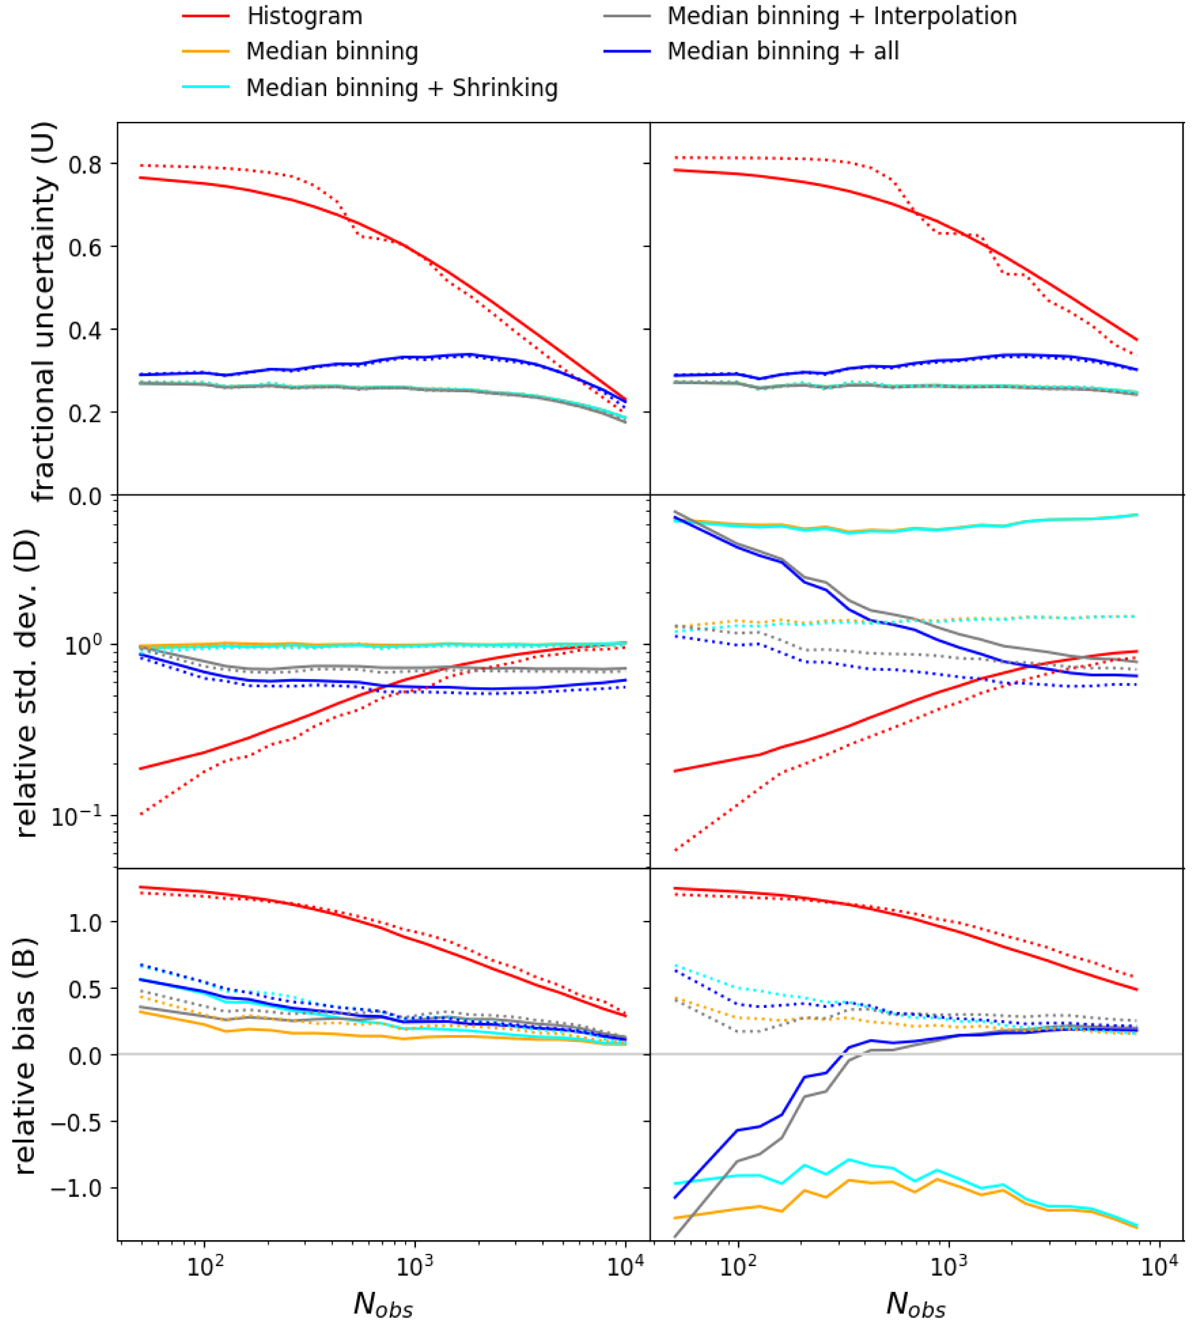
Comparison of the performance of different methods as a function of Nobs, applied for constant input selection function (left column) and RAVE-based ISF (right column). Results are shown as a function of the number of observed stars Nobs. Top row: fractional uncertainty; middle row: relative standard deviation and relative median absolute deviation (see Eqs. (9) and (10)); bottom row: relative bias B (see Eq. (8)). Solid lines are for mean values, dotted lines are for median values. Ncritical = 10 is used here.
Current usage metrics show cumulative count of Article Views (full-text article views including HTML views, PDF and ePub downloads, according to the available data) and Abstracts Views on Vision4Press platform.
Data correspond to usage on the plateform after 2015. The current usage metrics is available 48-96 hours after online publication and is updated daily on week days.
Initial download of the metrics may take a while.