Fig. 8
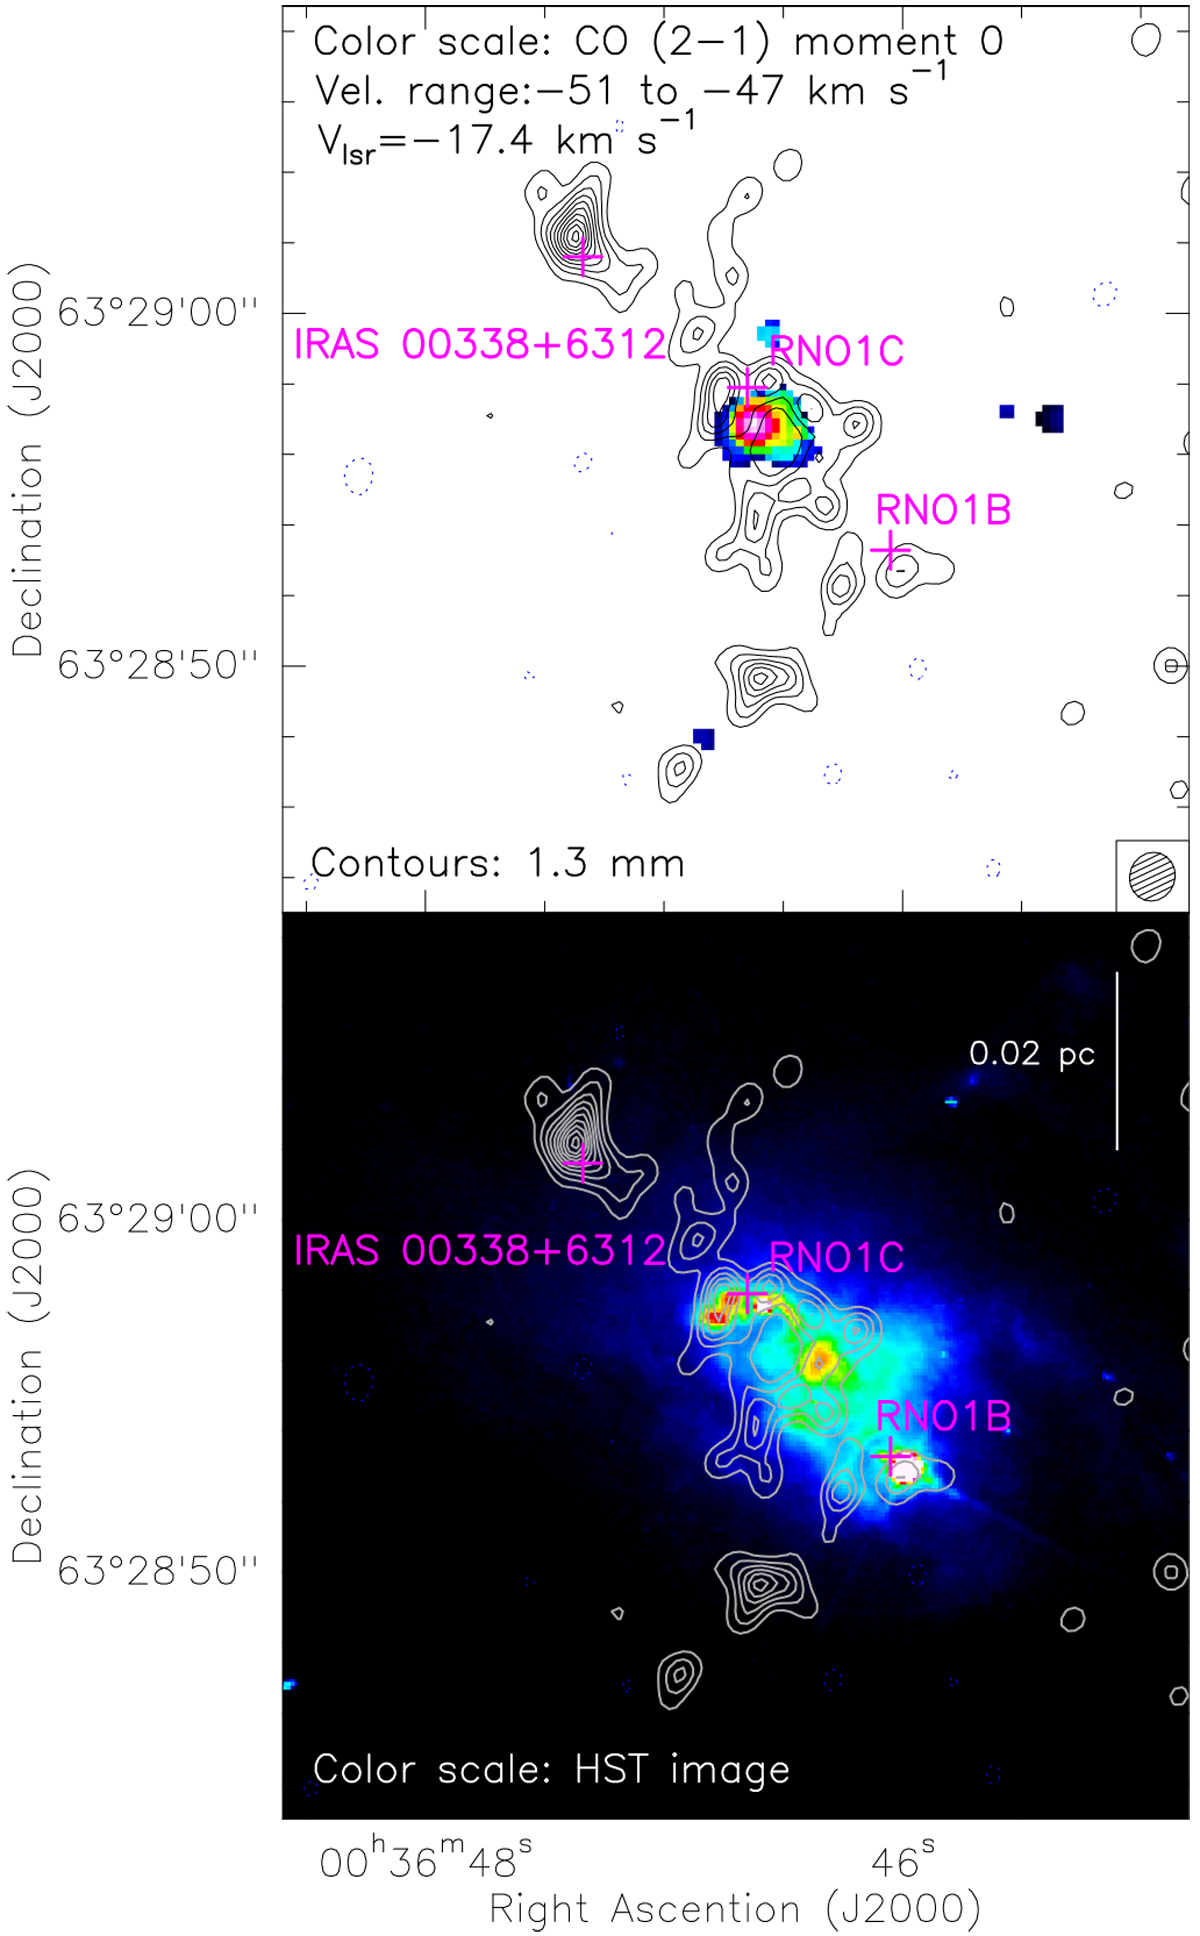
Upperpanel: CO (2–1) highest-velocity emission. Color scale: moment 0 (i.e., integrated intensity) map. Velocity range from − 51 to − 47 km s−1. The synthesized beam located at the bottom right corner is 1′′39 × 1′′27, PA = − 19°. Contours: 1.3-mm dust continuum emission. Pink crosses indicate infrared sources (Quanz et al. 2007). Lower panel: color scale –Hubble Space Telescope image. WFPC2 instrument, F814W filter.
Current usage metrics show cumulative count of Article Views (full-text article views including HTML views, PDF and ePub downloads, according to the available data) and Abstracts Views on Vision4Press platform.
Data correspond to usage on the plateform after 2015. The current usage metrics is available 48-96 hours after online publication and is updated daily on week days.
Initial download of the metrics may take a while.