Fig. 7
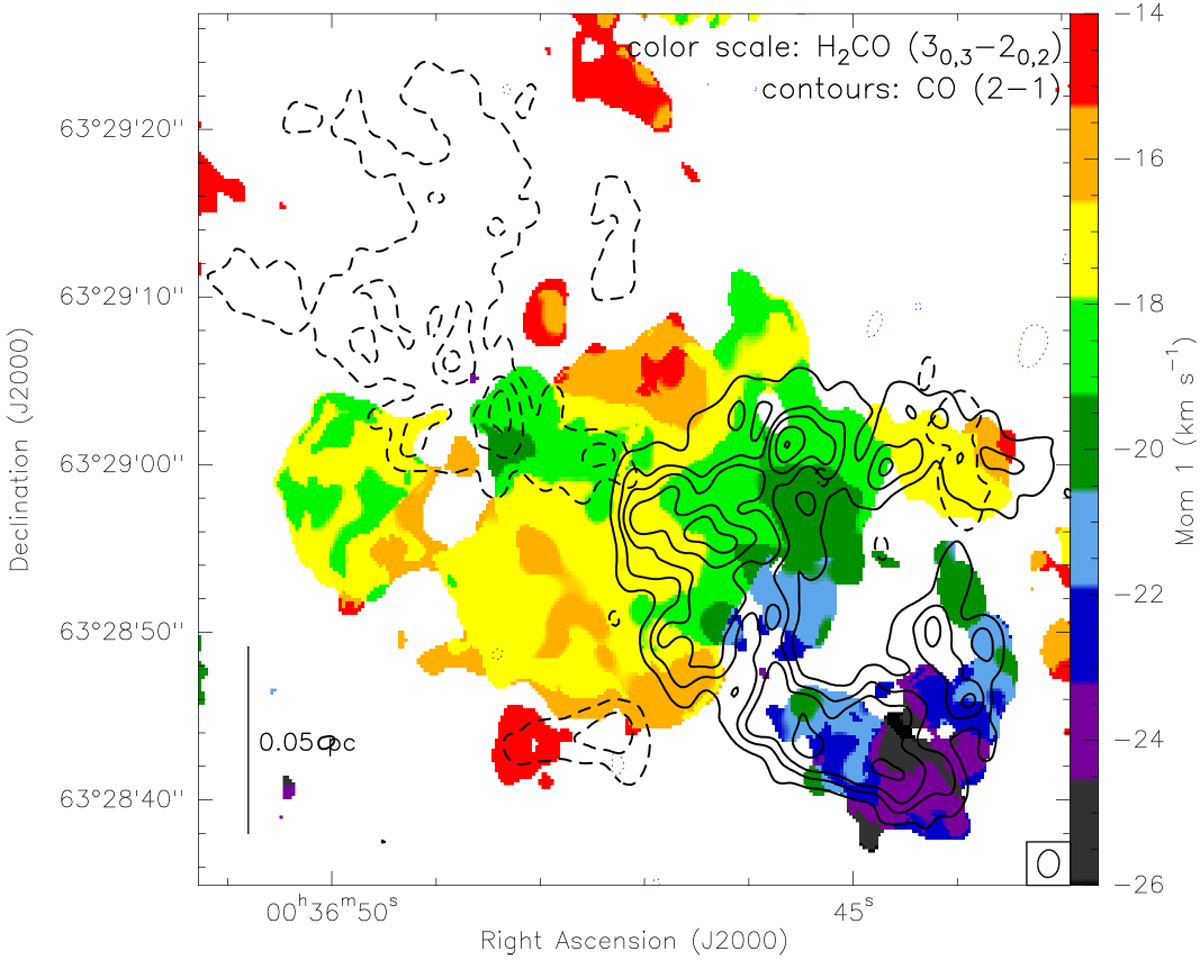
Contours: CO (2–1) red- (dashed) and blue-shifted emission (solid) at ± 12 km s−1 from the systemic velocity − 17.4 km s−1. Contour levels are − 6, 6, 18, 30, 50, 70 times the rms level 0.04 Jy beam−1. The synthesized beam located in the bottom-right corner is 1′′66 × 1′′38, PA = − 8°. Color scale: intensity-weighted averaged velocity (i.e., moment 1) map of H2CO 3(0,3)–2(0,2) emission. A scale bar is located in the bottom-left corner.
Current usage metrics show cumulative count of Article Views (full-text article views including HTML views, PDF and ePub downloads, according to the available data) and Abstracts Views on Vision4Press platform.
Data correspond to usage on the plateform after 2015. The current usage metrics is available 48-96 hours after online publication and is updated daily on week days.
Initial download of the metrics may take a while.