Fig. 6
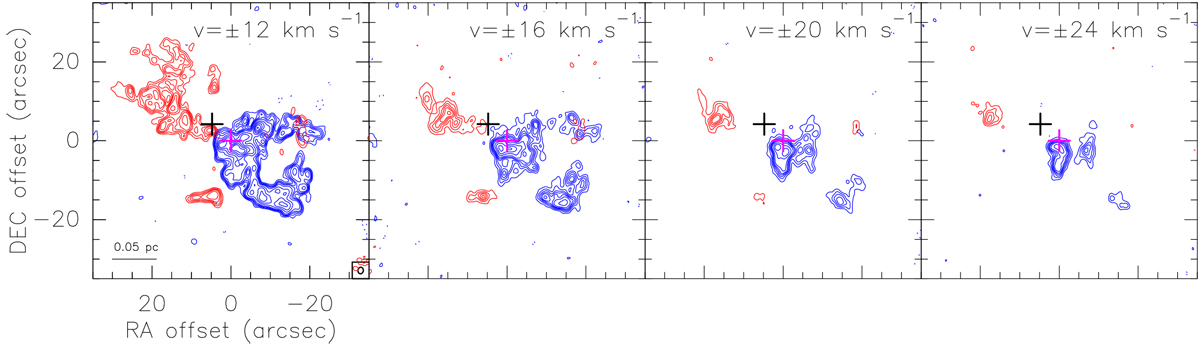
CO (2–1) high-velocity emission. Each panel shows the red- and blue-shifted emission at ± 12, ± 16, ± 20 and ± 24 km s−1 from the systemic velocity − 17.4 km s−1. Contour levels are − 6, 6, 9, ..., 15, 20, 30, 40, ..., 70 and − 3, 3, 6, 9, ..., 15, 20, 30, 40, 50 times the rms level 0.04 Jy beam−1 for the first and the rest of the panels, respectively. Black and pink crosses are IRAS 0038 + 6312 (also VLA 3) and RNO1C sources, respectively. The synthesized beam, located at bottom right of the first panel, is 1′′ 66 × 1′′38, PA = − 8°. A scale bar is located in the bottom-left corner.
Current usage metrics show cumulative count of Article Views (full-text article views including HTML views, PDF and ePub downloads, according to the available data) and Abstracts Views on Vision4Press platform.
Data correspond to usage on the plateform after 2015. The current usage metrics is available 48-96 hours after online publication and is updated daily on week days.
Initial download of the metrics may take a while.