Fig. 2
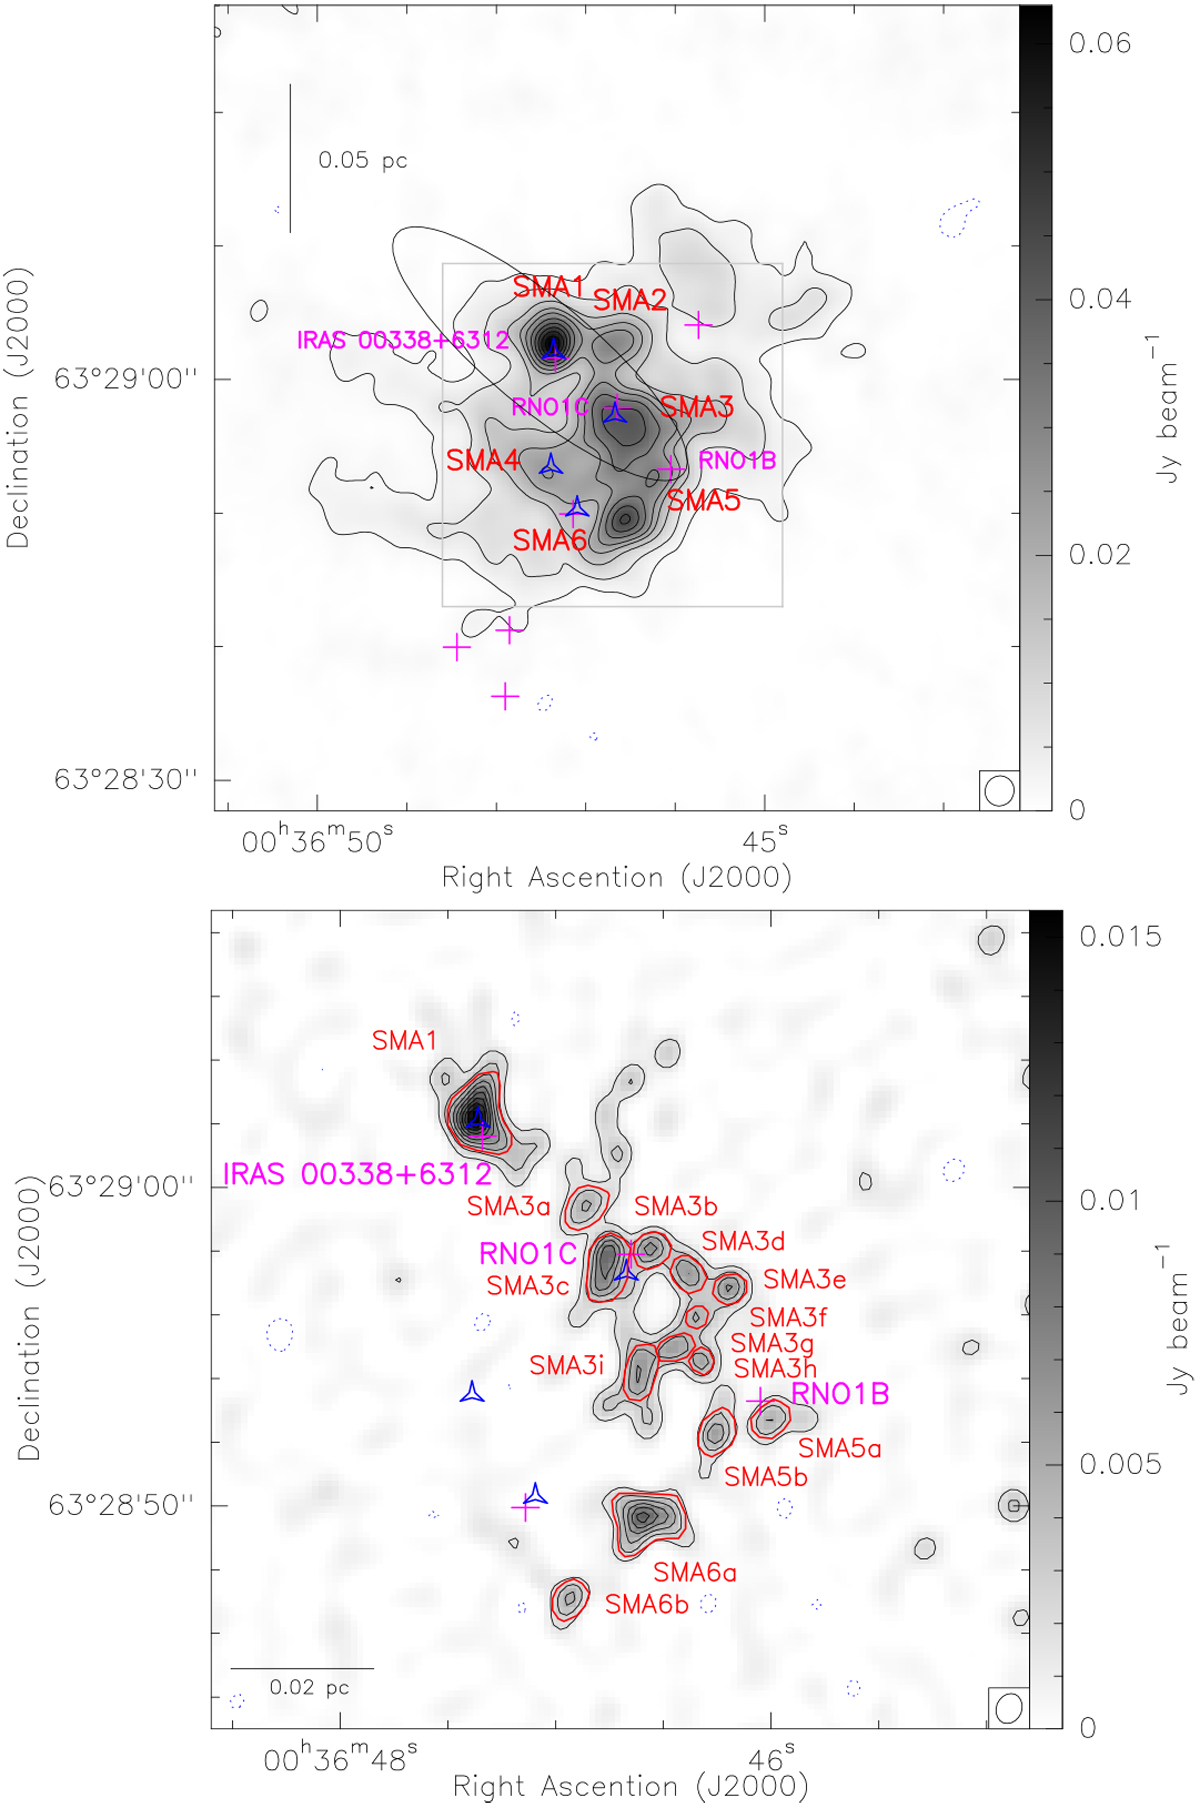
Top panel: 1.3-mm dust continuum emission with extended, compact, and subcompact configurations. Contours are − 6, − 3, 3, 6, 9, 20, 30, 38, 49, 60, 70, 80, and 90 times the rms level of the map, 0.6 mJy beam−1. Black ellipsecorresponds to the position error ellipse for IRAS 00338 + 6312. The synthesized beam located at the bottom right is 2′′28 × 2′′17, PA = − 19°. The gray square corresponds to the field of view of the bottom panel. A scale bar is located in the upper-left corner. Bottom panel: 1.3-mm dust continuum emission with extended configuration. Contours are − 3, 3, 6, 9, 12, 15, 18, 21, 24, 27 and 30 times the rms level of the map, 0.5 mJy beam−1. Sources (labeled in red) are defined as having at least a 7σ closed contour. Red contours are drawn following the 6 and 9 sigma contour levels for themost extended sources. The synthesized beam located at the bottom right is 0′′ 96 × 0′′79, PA = − 22°. A scale bar is shown in the lower left corner. Blue concave hexagons and pink crosses in both panels are radio (Anglada et al. 1994)and infrared (Quanz et al. 2007) sources, respectively.
Current usage metrics show cumulative count of Article Views (full-text article views including HTML views, PDF and ePub downloads, according to the available data) and Abstracts Views on Vision4Press platform.
Data correspond to usage on the plateform after 2015. The current usage metrics is available 48-96 hours after online publication and is updated daily on week days.
Initial download of the metrics may take a while.