Fig. 11
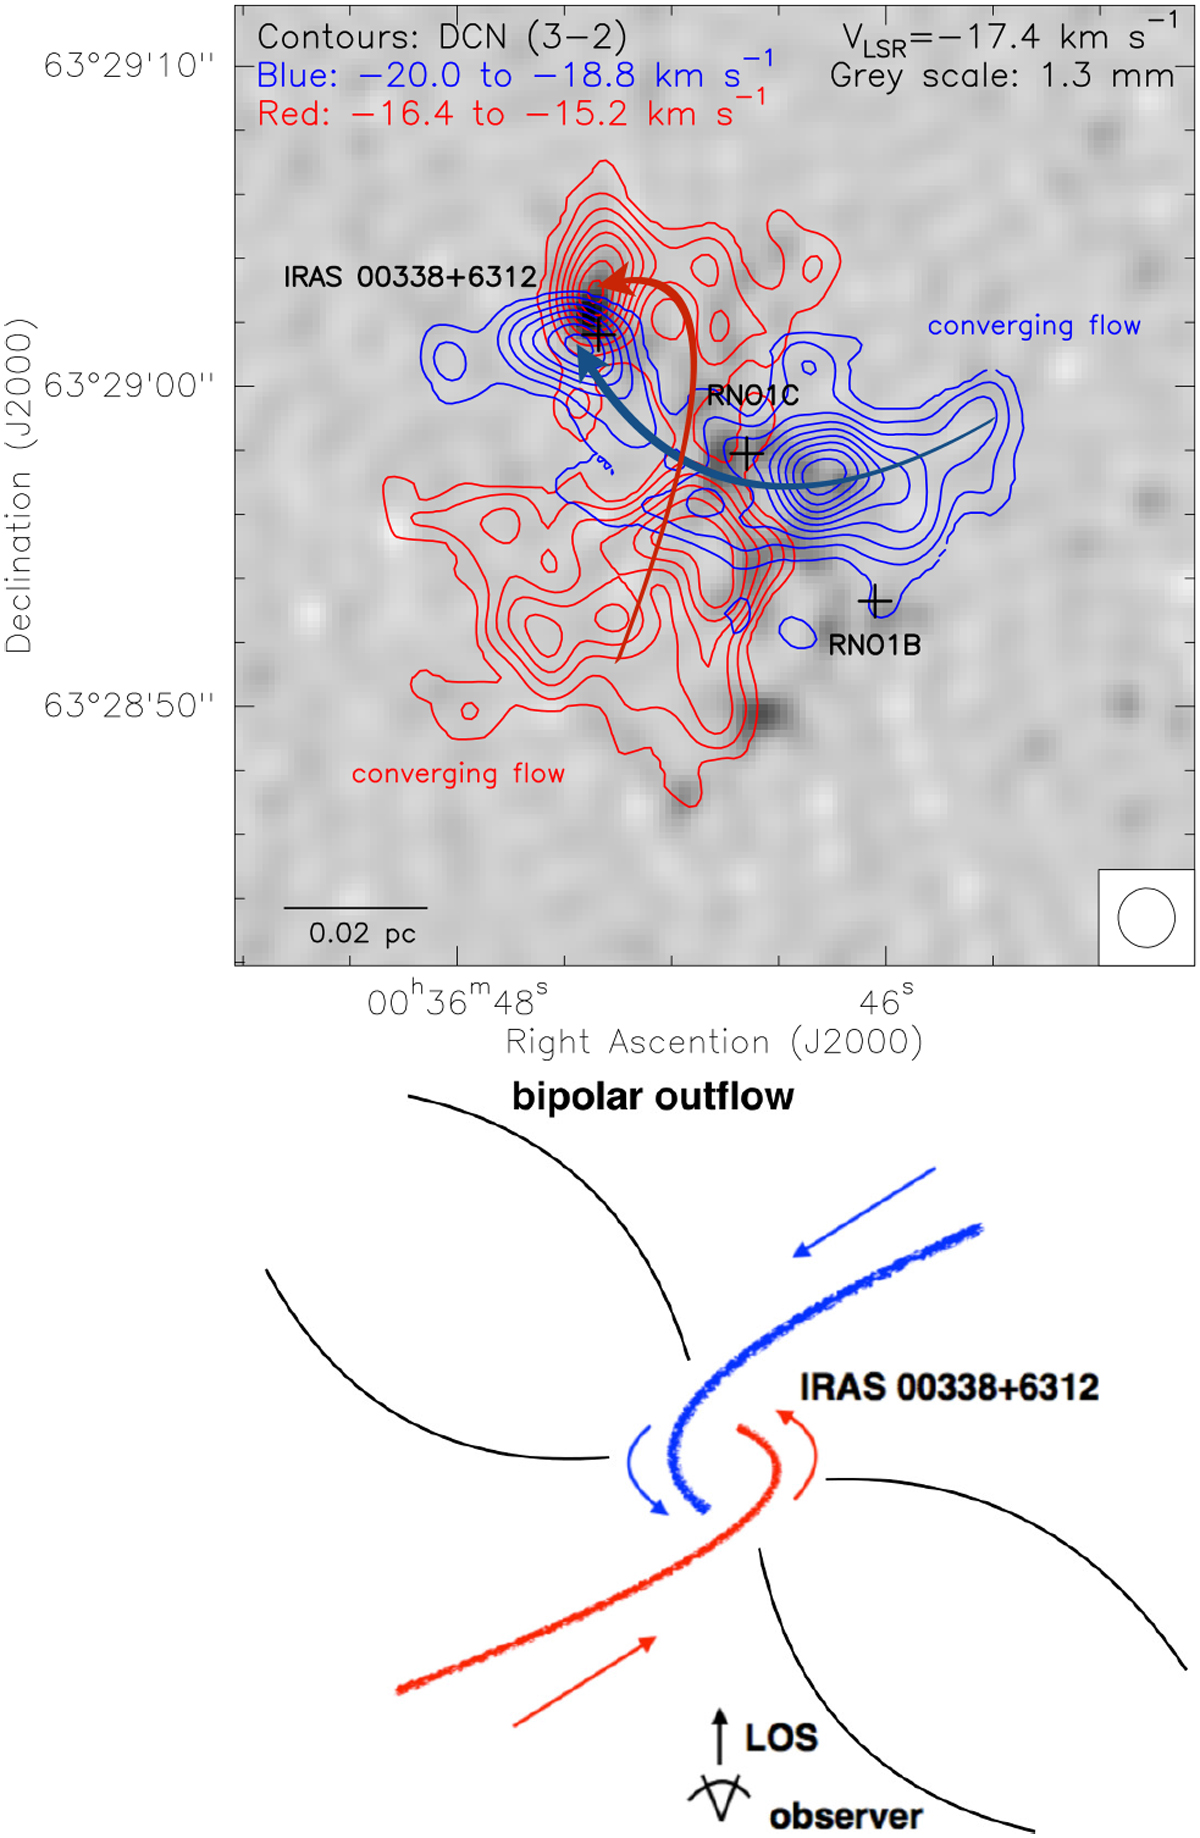
Upper panel: contours correspond to the averaged emission from blue- and red-shifted channels of DCN (3–2) displaying the two low-velocity flow components. Contours are 6, 9, 12, 15, ..., 30 times the rms noise level of the map, 0.03 Jy beam−1. The synthesized beam is located at the bottom right corner. The grey scale corresponds to the 1.3 mm dust continuum emission. The arrows indicate the two possible converging flows of the region. Black crosses indicate the position of infrared sources IRAS 00338 + 6312 and FU-Orionis RNO1B and RNO1C (Quanz et al. 2007). Lower panel: schematic model of the L1287 region. Converging flows + rotation dynamics. The blue and red lines indicate the ~ 0.1 pc scale molecular gas converging towards the center. We can observe a reversed velocity gradient projected towards our line of sight as we can see at the IRAS 00338 + 6312 source.
Current usage metrics show cumulative count of Article Views (full-text article views including HTML views, PDF and ePub downloads, according to the available data) and Abstracts Views on Vision4Press platform.
Data correspond to usage on the plateform after 2015. The current usage metrics is available 48-96 hours after online publication and is updated daily on week days.
Initial download of the metrics may take a while.