Fig. 10
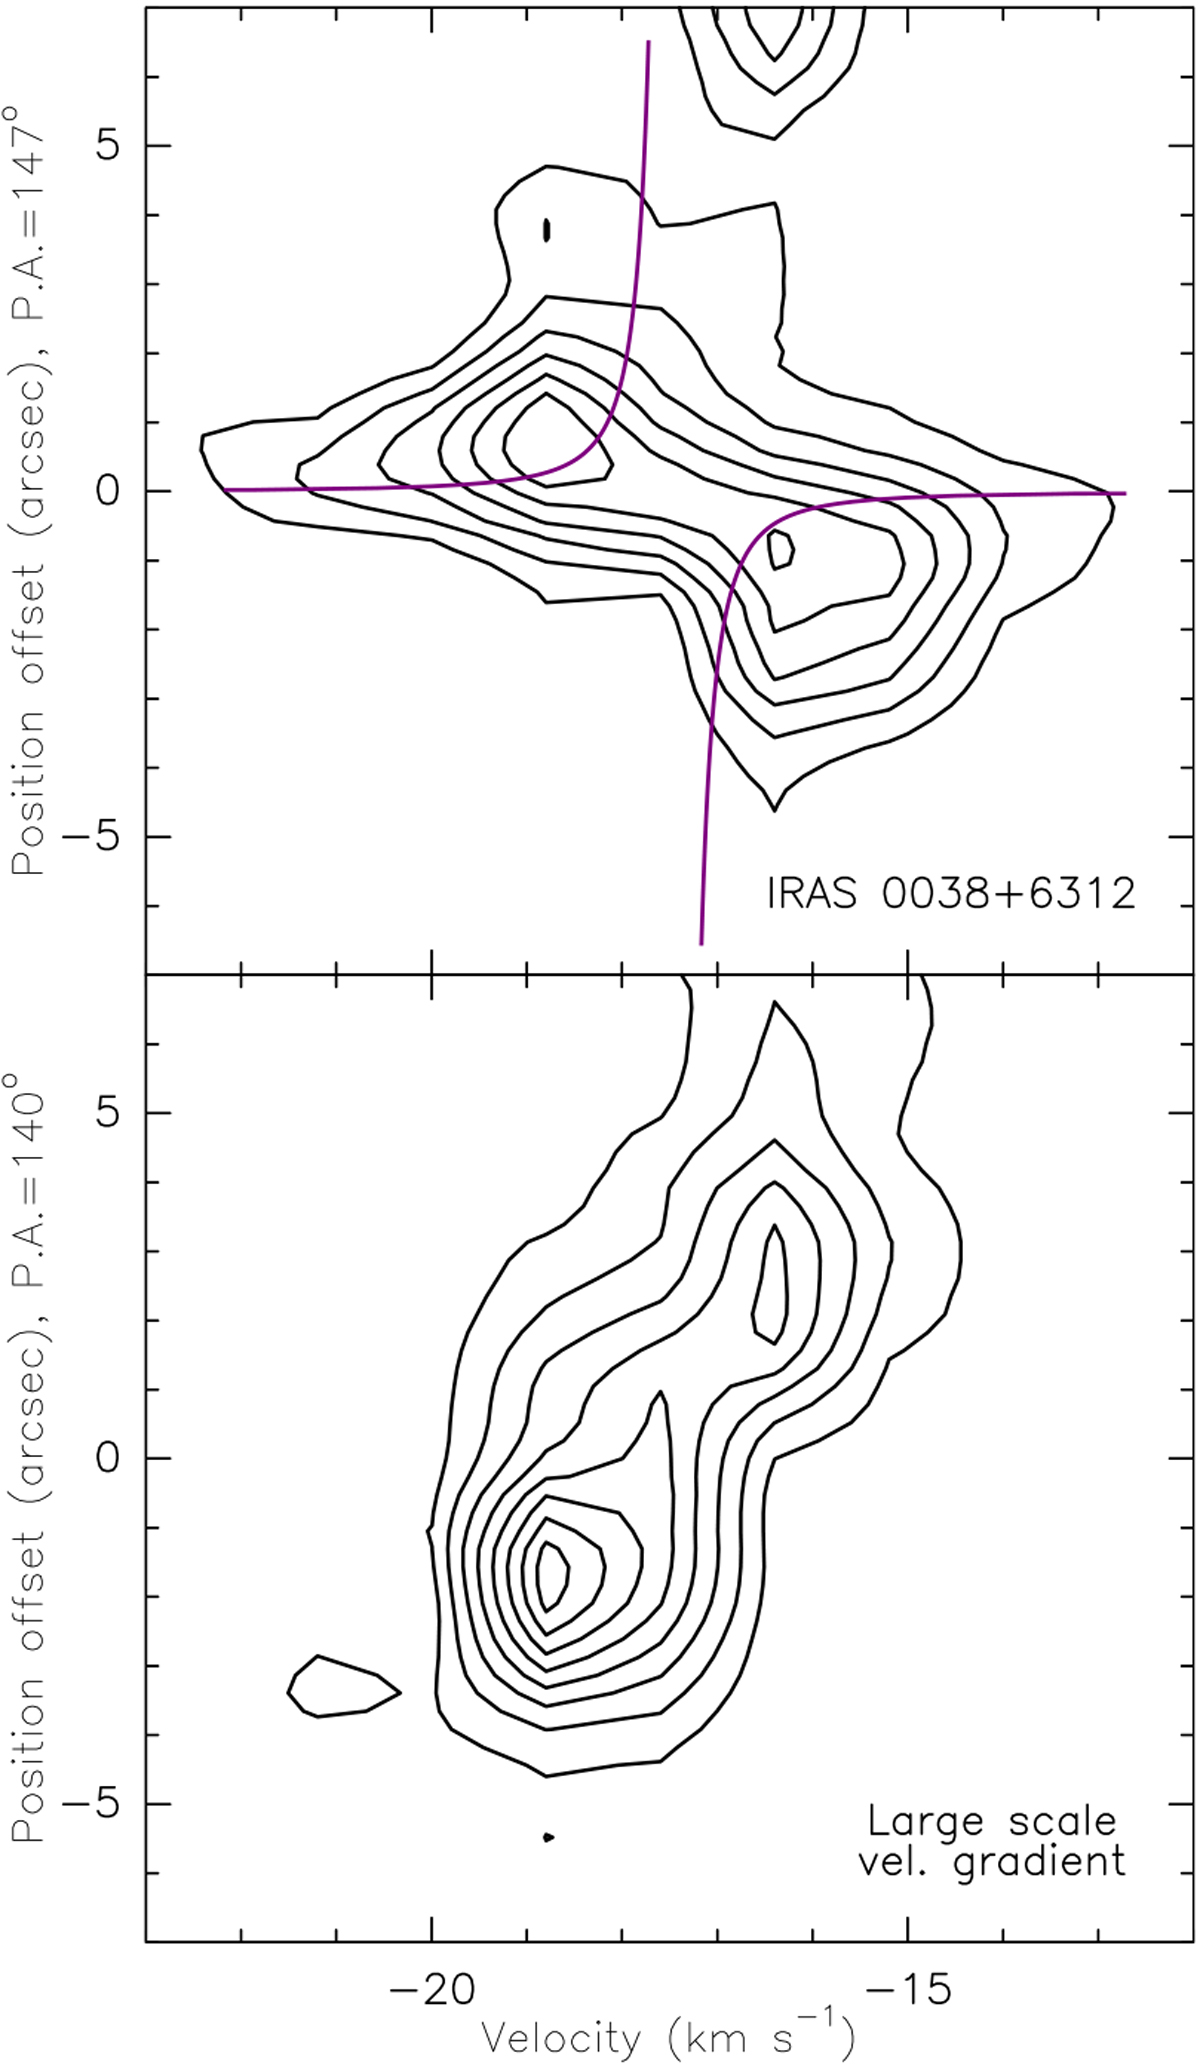
DCN (3–2) position-velocity maps. Upper panel: emission along the velocity gradient at the IRAS 0038 + 6312 source. Contours are − 3, 3, 5, 7, ..., 13 times the rms noise level of the map, 0.03 Jy beam−1. The purple lines indicate a keplerian velocity distribution. Lower panel: emission along the large velocity gradient passing through the center of the toroid traced by the dust continuum emission. Contours are − 3, 3, 6, 9, ..., 24 times the rms noise level of the map, 0.03 Jy beam−1.
Current usage metrics show cumulative count of Article Views (full-text article views including HTML views, PDF and ePub downloads, according to the available data) and Abstracts Views on Vision4Press platform.
Data correspond to usage on the plateform after 2015. The current usage metrics is available 48-96 hours after online publication and is updated daily on week days.
Initial download of the metrics may take a while.