Fig. 8
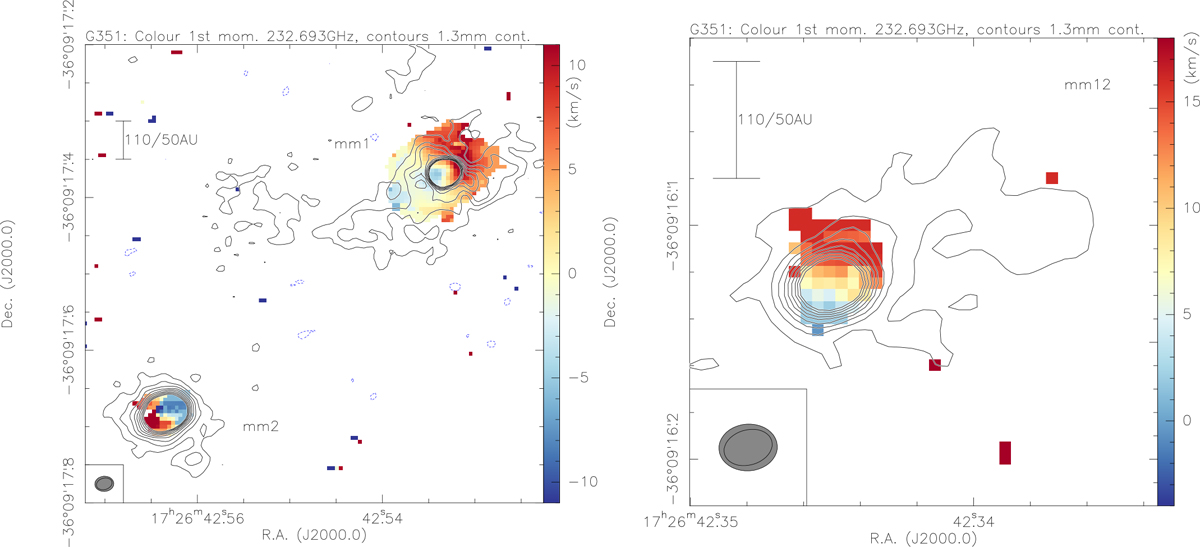
Color-scale first moment maps (intensity-weighted peak velocities) from the line at 232.693 GHz. Left panel: focus on mm1 and mm2. Right panel: mm12. The contours are the 1.3 mm continuum data in 4σ level of 0.2 mJy beam−1 up to a 3 mJy beam−1 level (to avoid too many contours in the center). A scale-bar and the resolution elements of the line (gray) and continuum are shown as well.
Current usage metrics show cumulative count of Article Views (full-text article views including HTML views, PDF and ePub downloads, according to the available data) and Abstracts Views on Vision4Press platform.
Data correspond to usage on the plateform after 2015. The current usage metrics is available 48-96 hours after online publication and is updated daily on week days.
Initial download of the metrics may take a while.