Fig. 6
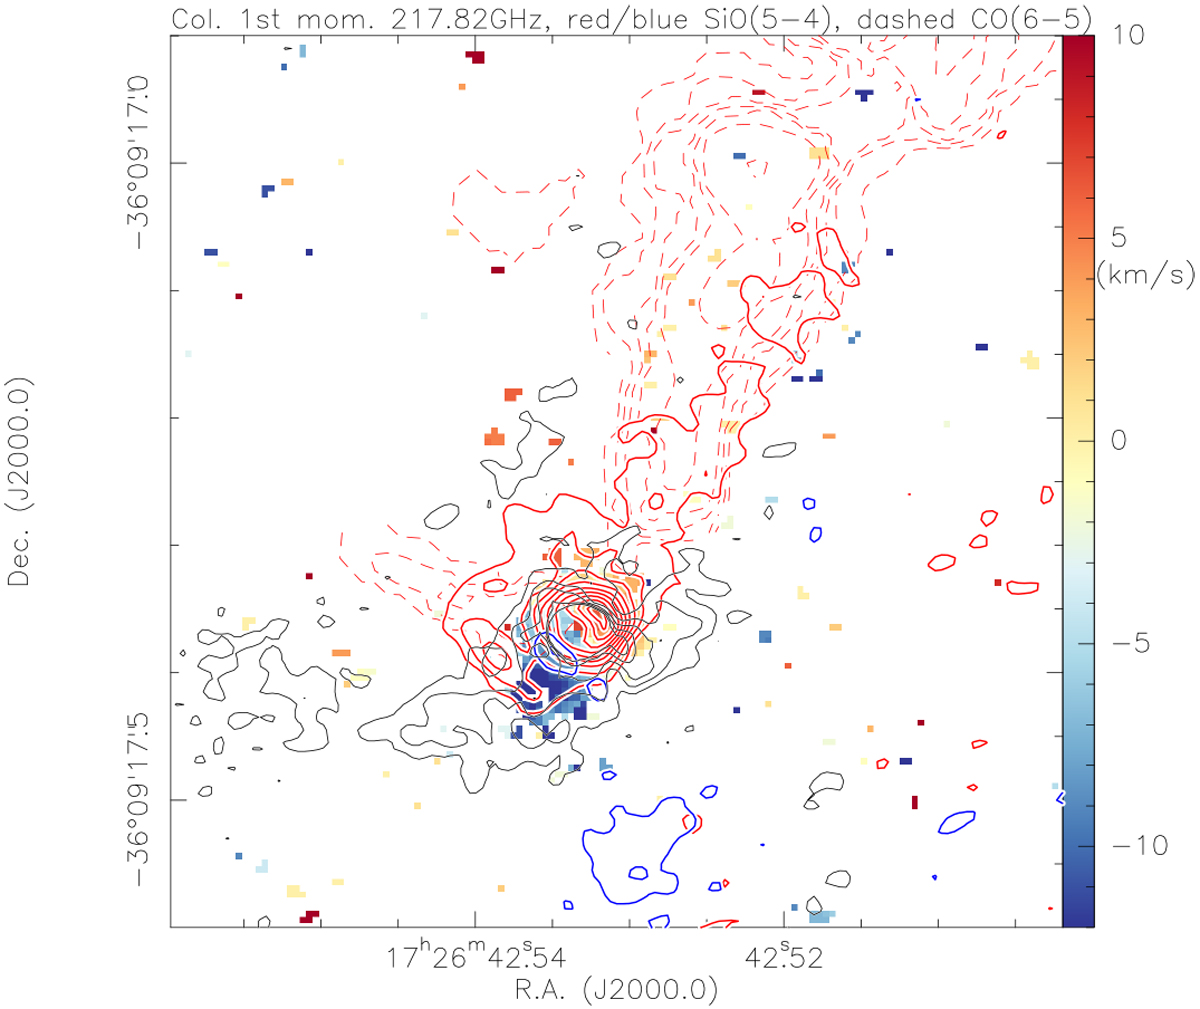
Color-scale first moment map (intensity-weighted peak velocities) for mm1 from the line at 217.82 GHz. The blue and red solid contours present the blue- and redshifted SiO(5–4) emission integrated between [−22,−14] and [0,24] km s−1, respectively. The red dashed contours show the red-shifted CO(6–5) emission from Beuther et al. (2017b). Blue-shifted CO(6–5) can not be properly imaged in that dataset, most likely because of missing short spacings. The black contours show the lower level 1.3 mm continuum data from the 4σ levels of 0.2 to 1.0 mJy beam−1 in 4σ steps.
Current usage metrics show cumulative count of Article Views (full-text article views including HTML views, PDF and ePub downloads, according to the available data) and Abstracts Views on Vision4Press platform.
Data correspond to usage on the plateform after 2015. The current usage metrics is available 48-96 hours after online publication and is updated daily on week days.
Initial download of the metrics may take a while.