Free Access
Fig. 5
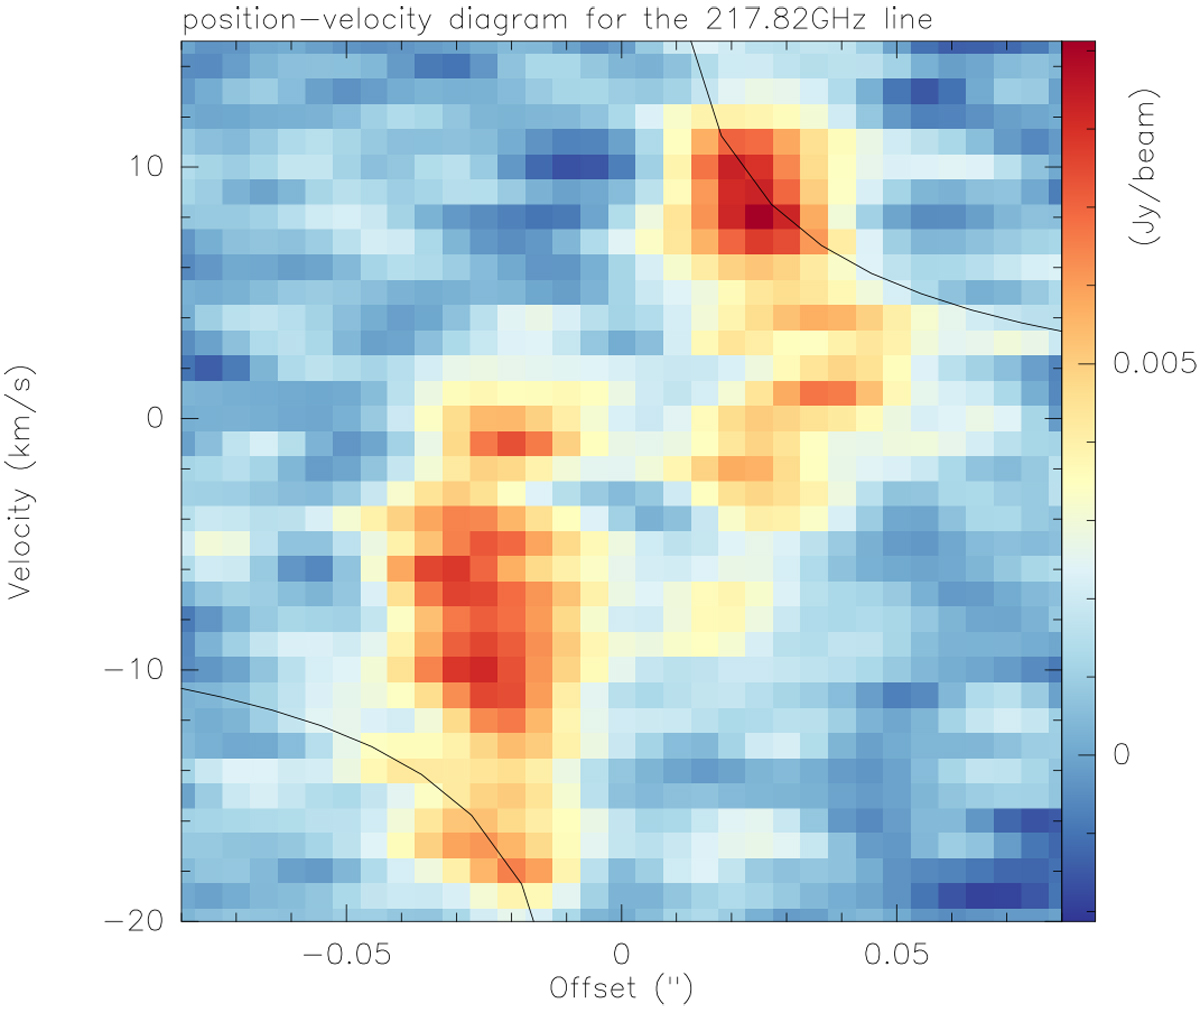
Color-scale position–velocity diagram for mm1 for the line at 217.82 GHz along the axis of the strong velocity gradient visible in Fig. 3. The lines correspond to a Keplerian curve around a 10 M⊙ central object, not representing the data well.
Current usage metrics show cumulative count of Article Views (full-text article views including HTML views, PDF and ePub downloads, according to the available data) and Abstracts Views on Vision4Press platform.
Data correspond to usage on the plateform after 2015. The current usage metrics is available 48-96 hours after online publication and is updated daily on week days.
Initial download of the metrics may take a while.