Fig. 4
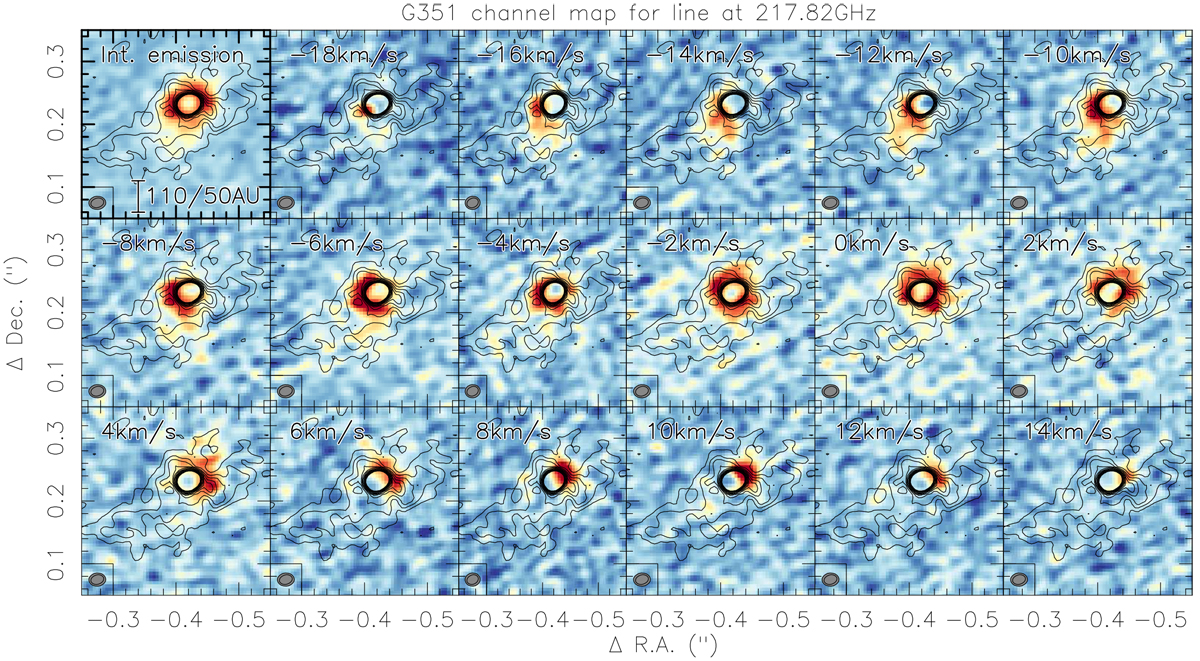
Channel map of the 217.82 GHz line for mm1. Top-left panel: integrated emission between −18 and +14 km s−1. The remaining panels show the channels with 2 km s−1 width at the velocities marked at the top-left of each panel. The contours are the 1.3 mm continuum data in 4σ level of 0.2 mJy beam−1 up to a 3 mJy beam−1 level (to avoid too many contours in the center). A scale-bar is shown in the top-left panel, and the resolution elements of the line (gray) and continuum are presented in each panel. The vlsr is at approximately − 3.6 km s−1.
Current usage metrics show cumulative count of Article Views (full-text article views including HTML views, PDF and ePub downloads, according to the available data) and Abstracts Views on Vision4Press platform.
Data correspond to usage on the plateform after 2015. The current usage metrics is available 48-96 hours after online publication and is updated daily on week days.
Initial download of the metrics may take a while.