Fig. 3
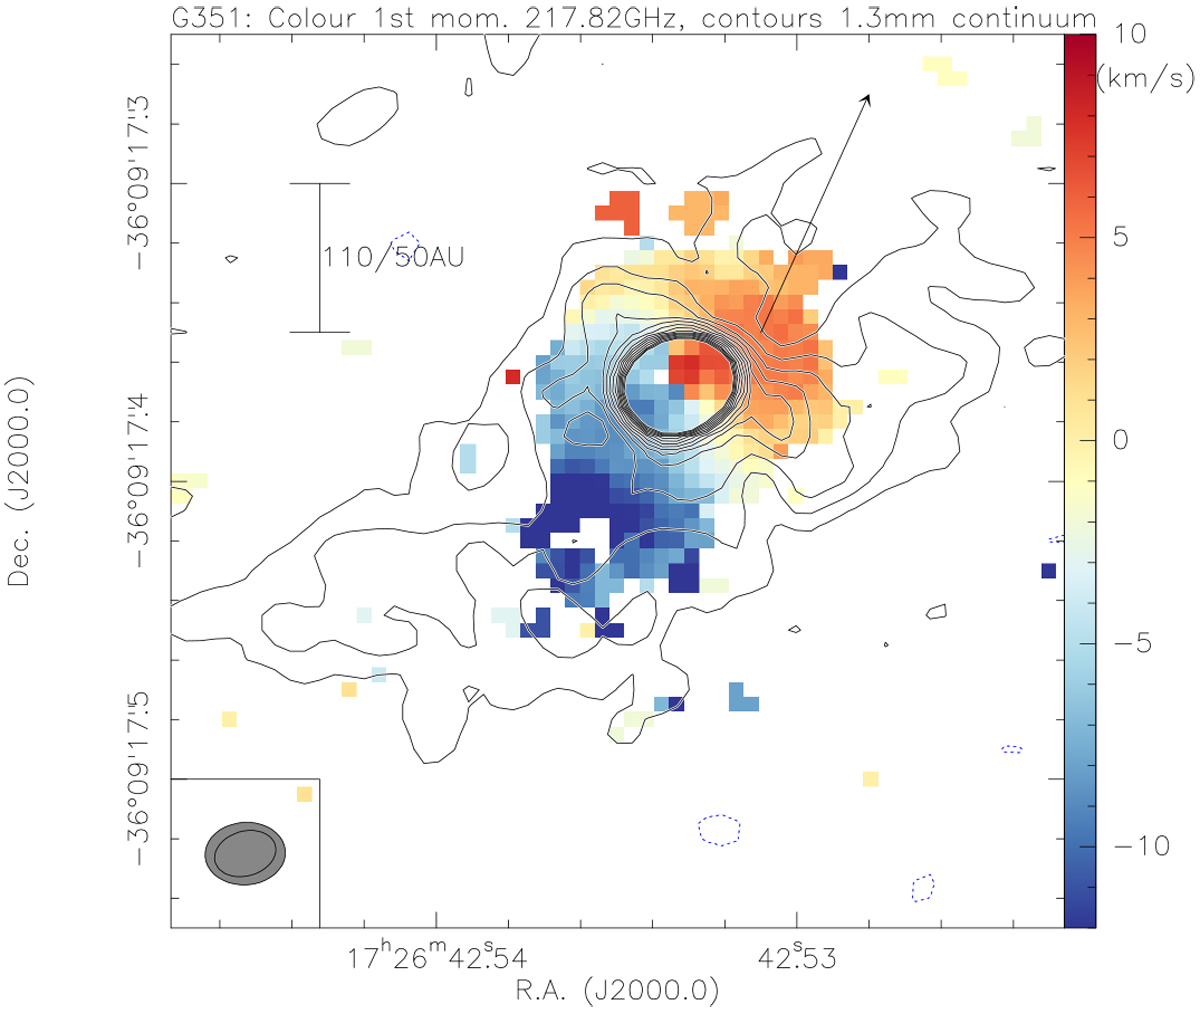
Color-scale first moment map (intensity-weighted peak velocities) for mm1 from the line at 217.82 GHz. The contours are the 1.3 mm continuum data in 4σ levels of 0.2 mJy beam−1 up to a 3 mJy beam−1 level (to avoid too many contours in the center). A scale-bar and the resolution elements of the line (gray) and continuum are shown as well. The arrow outlines the approximate direction of the CO(6–5) red outflow lobe shown in Fig. 6.
Current usage metrics show cumulative count of Article Views (full-text article views including HTML views, PDF and ePub downloads, according to the available data) and Abstracts Views on Vision4Press platform.
Data correspond to usage on the plateform after 2015. The current usage metrics is available 48-96 hours after online publication and is updated daily on week days.
Initial download of the metrics may take a while.