Fig. 2
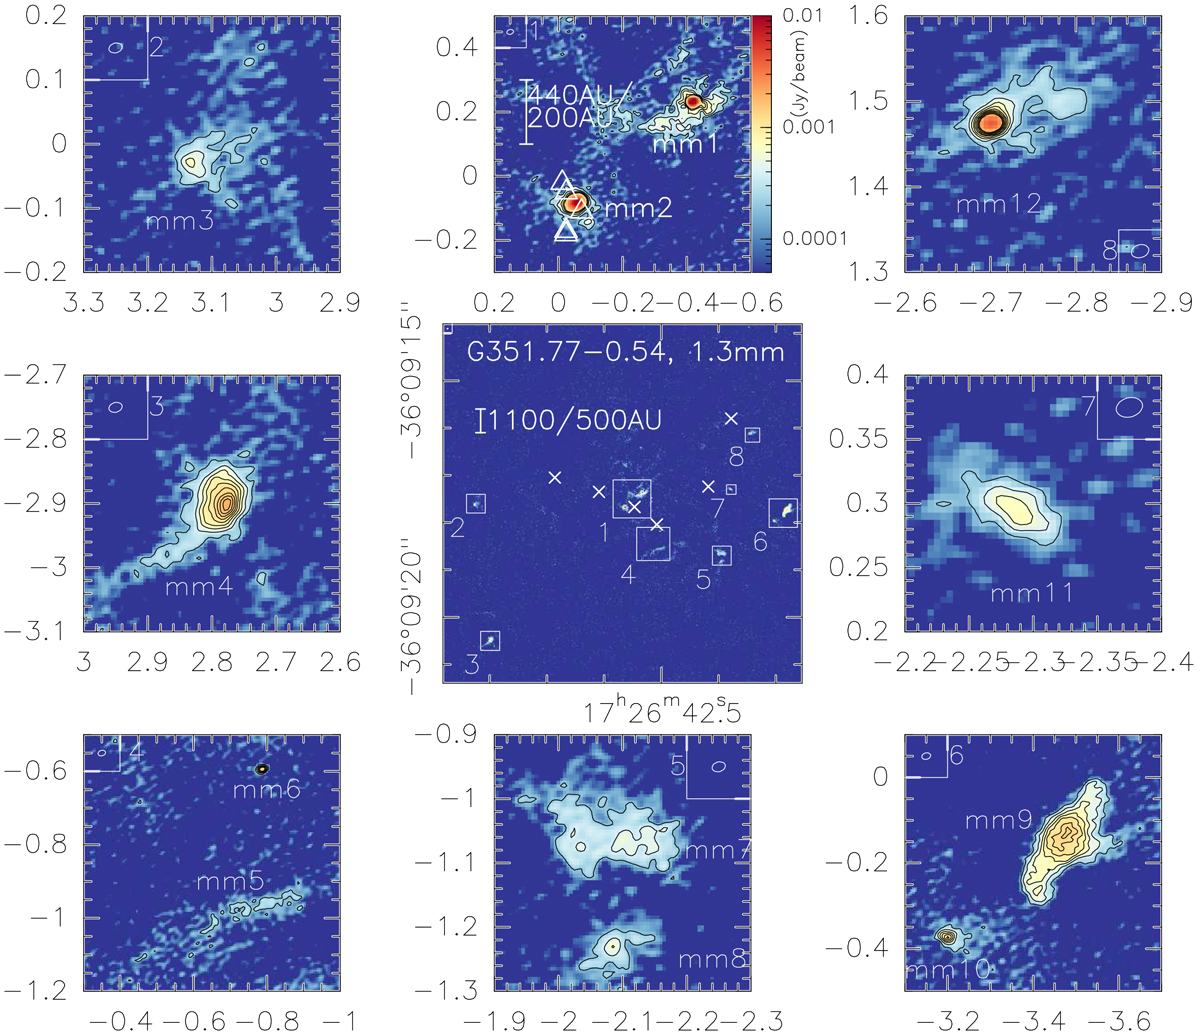
ALMA 1.3 mm continuum data toward the high-mass star-forming region G351.77-0.54 at an angular resolution of 0.021″ × 0.015″. Central panel: overall structure (the white crosses mark the cm continuum source positions from Zapata et al. 2008), and the surrounding panels show selected zooms into the areas marked in the central panel. We note the different cutout sizes of the individual zoom windows. The contour levels always start at a 4σ level of 0.2 mJy beam−1 and continuein 4σ steps. Scalebars assuming 1.0/2.2 kpc distance are shown in the middle and middle top panels. Middle top panel: CH3 OH maser positions from Walsh et al. (1998) and an intensity scale. The synthesized beam is presented in each panel.
Current usage metrics show cumulative count of Article Views (full-text article views including HTML views, PDF and ePub downloads, according to the available data) and Abstracts Views on Vision4Press platform.
Data correspond to usage on the plateform after 2015. The current usage metrics is available 48-96 hours after online publication and is updated daily on week days.
Initial download of the metrics may take a while.