Fig. 6.
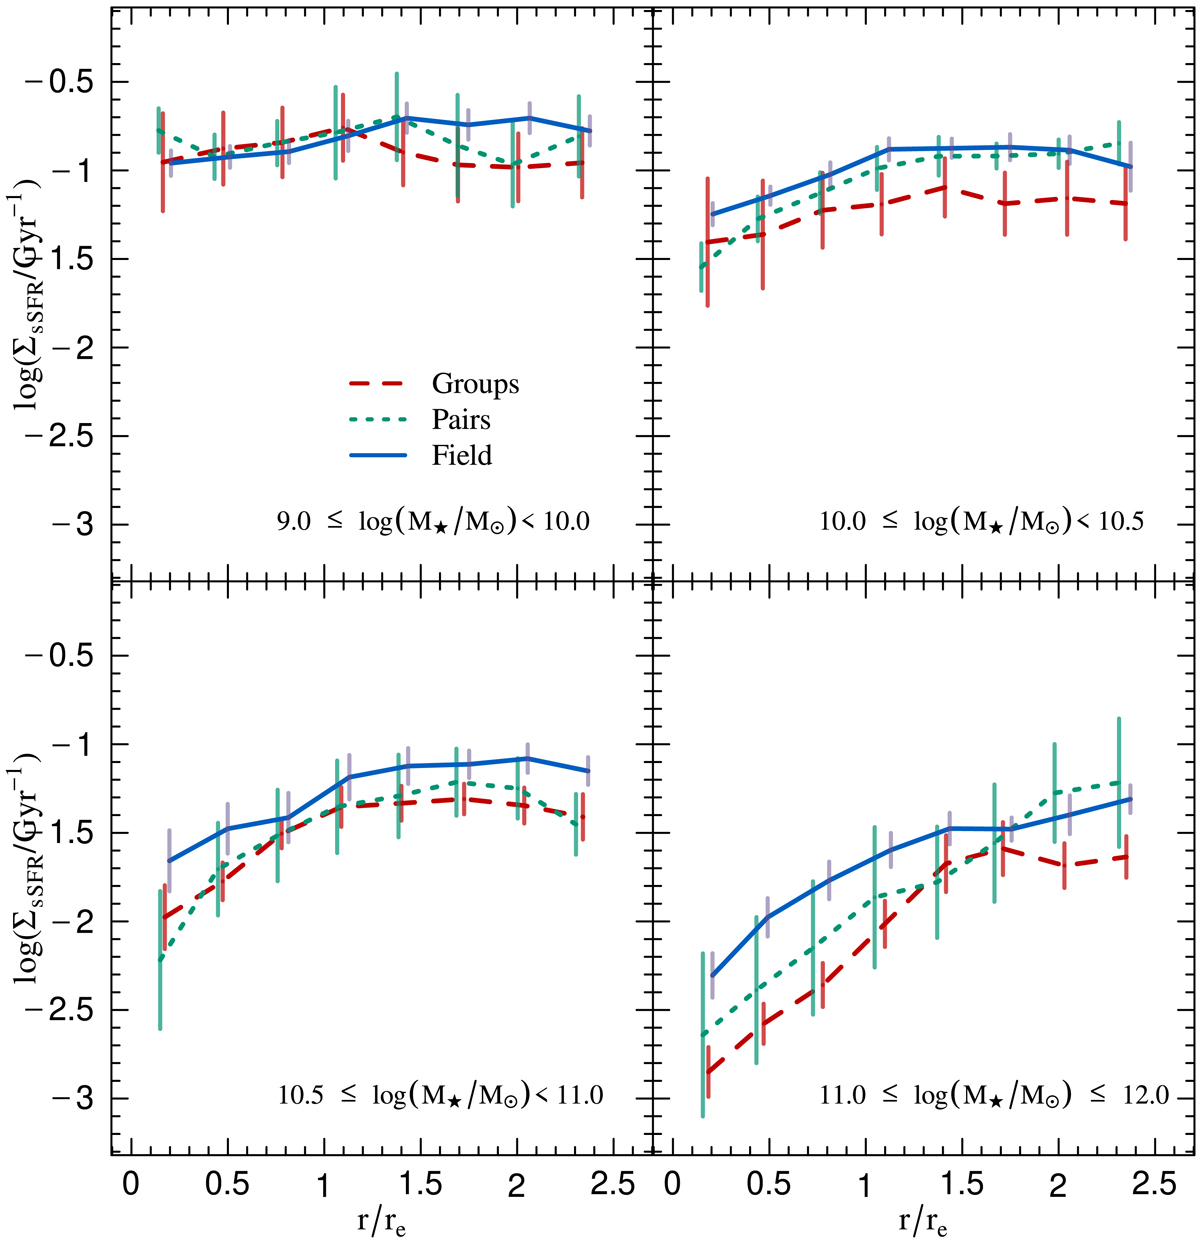
Stacked profile of the sSFR ΣsSFR for late-type galaxies as a function of the environment. Each panel corresponds to a different mass bin. Galaxies in groups are shown in red lines, galaxies in pairs in green lines, and field galaxies in blue lines. Lines represent the median in each radial bin. Vertical error bars are as in Fig. 4. Field galaxies and galaxies in pairs have been shifted by 0.03 and −0.03 on the x-axis, respectively.
Current usage metrics show cumulative count of Article Views (full-text article views including HTML views, PDF and ePub downloads, according to the available data) and Abstracts Views on Vision4Press platform.
Data correspond to usage on the plateform after 2015. The current usage metrics is available 48-96 hours after online publication and is updated daily on week days.
Initial download of the metrics may take a while.