Fig. 1.
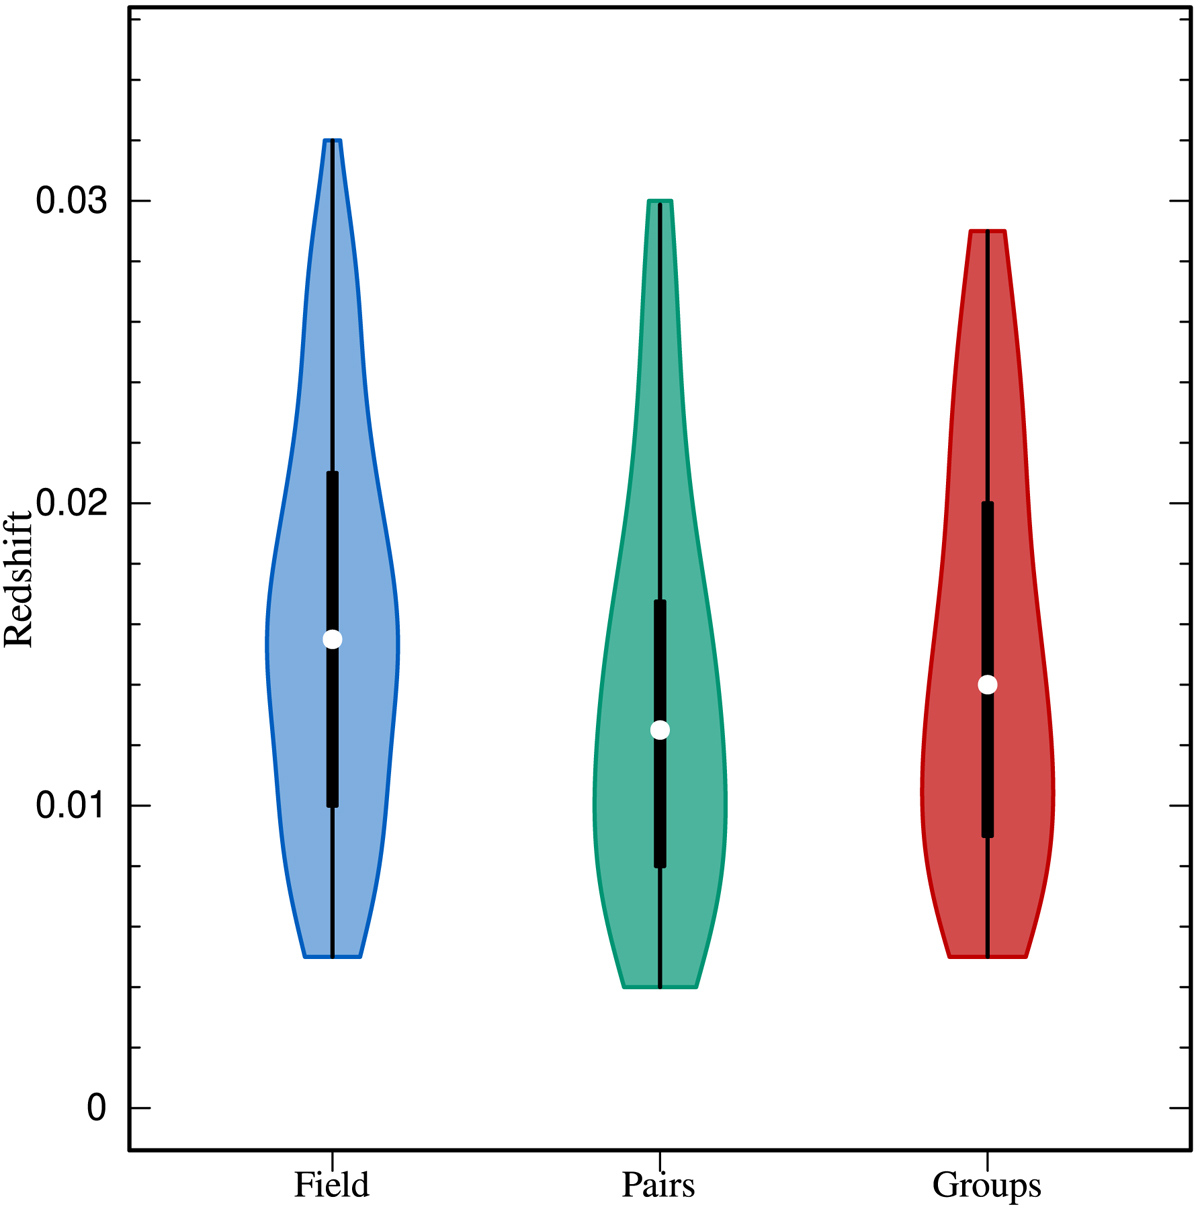
Violin plot of the redshift distributions of our sample of late-type galaxies. The box plot inside each violin shows the interquartile range. The inner dot in the box plot represents the median of the distribution. The widths of the violin plots are scaled by the number of observations in each bin: 96 field galaxies, 64 galaxies in pairs, and 67 galaxies in groups. Only galaxies with maps of sSFR are shown.
Current usage metrics show cumulative count of Article Views (full-text article views including HTML views, PDF and ePub downloads, according to the available data) and Abstracts Views on Vision4Press platform.
Data correspond to usage on the plateform after 2015. The current usage metrics is available 48-96 hours after online publication and is updated daily on week days.
Initial download of the metrics may take a while.