Fig. 8.
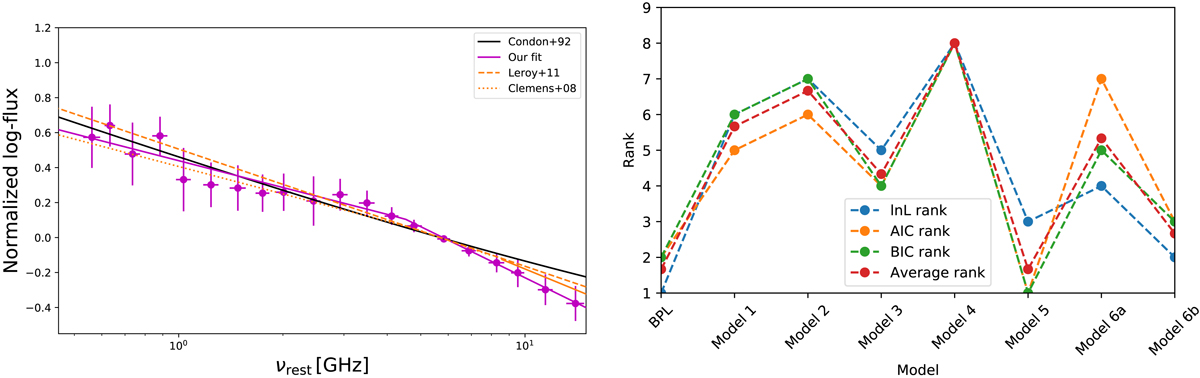
Left panel: comparison of the average SED data (magenta points) and our broken power-law fit (magenta lines) with different literature SEDs (Clemens et al. 2008; Leroy et al. 2011) for ULIRGs. For comparison, we show the Condon (1992) model for a normal SFG. Right panel: comparison of the different goodness-of-fit tests for different models. We show the log-likelihood test and the Akaike and Bayesian information criteria. We give the average of these three criteria for reference.
Current usage metrics show cumulative count of Article Views (full-text article views including HTML views, PDF and ePub downloads, according to the available data) and Abstracts Views on Vision4Press platform.
Data correspond to usage on the plateform after 2015. The current usage metrics is available 48-96 hours after online publication and is updated daily on week days.
Initial download of the metrics may take a while.