Fig. 7.
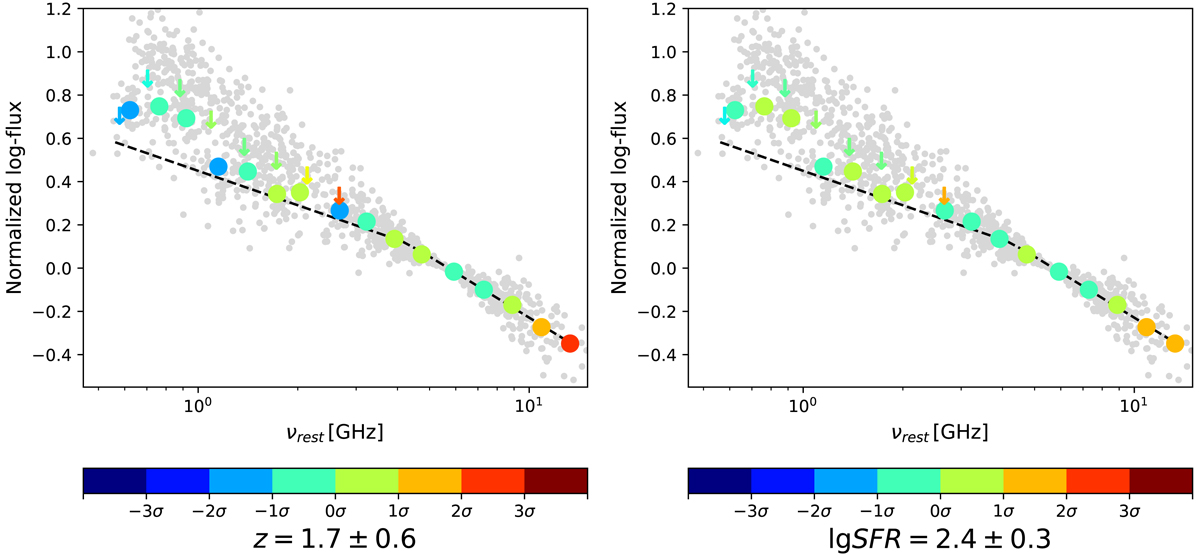
Mean properties of various rest-frame frequency bins in the HSFG radio SED. Shown are the mean redshift (left panel) and log SFR values (right panel) for each bin. Colored circles show the means of detections, while down-pointing arrows show the mean values for non-detections in each redshift bin. The dashed line shows the best-fitting broken power-law SED.
Current usage metrics show cumulative count of Article Views (full-text article views including HTML views, PDF and ePub downloads, according to the available data) and Abstracts Views on Vision4Press platform.
Data correspond to usage on the plateform after 2015. The current usage metrics is available 48-96 hours after online publication and is updated daily on week days.
Initial download of the metrics may take a while.