Fig. 6.
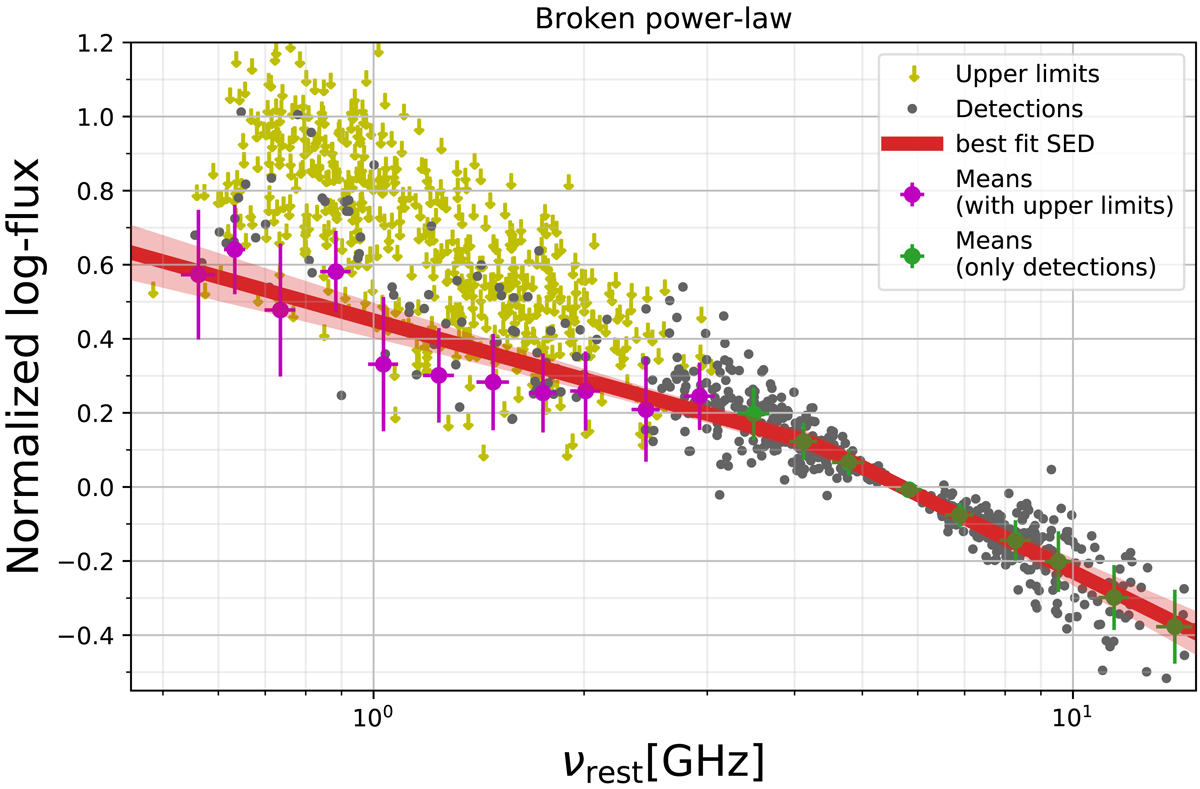
Average SED of the star-forming galaxy sample. Gray data points show individual detections, yellow arrows show upper limits, green circles show means in bins with no upper limits, and magenta circles show mean values derived using survival analysis. The red shaded interval shows the broken power-law fit with its 1σ error confidence interval. The errors derived using survival analysis are the standard deviations of the Weibull distribution that was fit on the Kaplan–Meier survival function.
Current usage metrics show cumulative count of Article Views (full-text article views including HTML views, PDF and ePub downloads, according to the available data) and Abstracts Views on Vision4Press platform.
Data correspond to usage on the plateform after 2015. The current usage metrics is available 48-96 hours after online publication and is updated daily on week days.
Initial download of the metrics may take a while.