Fig. 4.
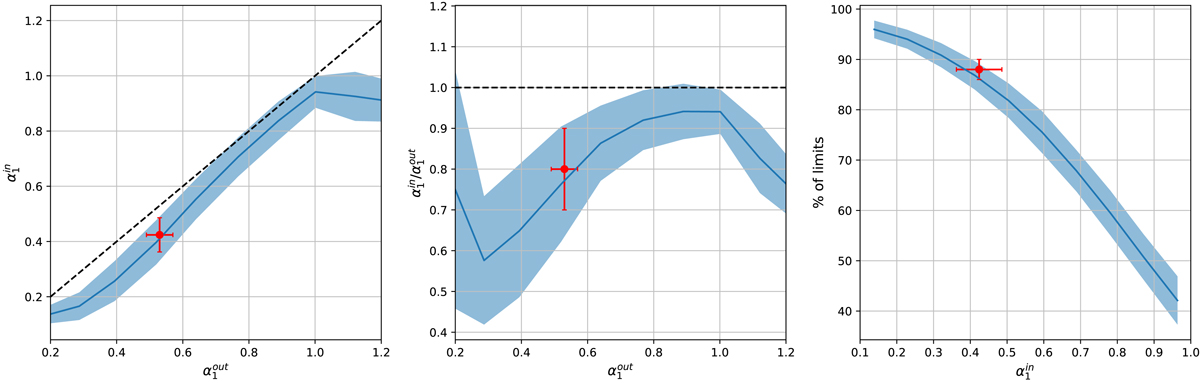
Results of simulations produced by varying the mean value of the input spectral index α1 (labeled as ![]() ). The figure shows the interdependence of the following properties: the input spectral index
). The figure shows the interdependence of the following properties: the input spectral index ![]() , the derived spectral index
, the derived spectral index ![]() , and the percentage of upper limits below 1 GHz. Left panel: dependence of the input spectral index,
, and the percentage of upper limits below 1 GHz. Left panel: dependence of the input spectral index, ![]() , on
, on ![]() ; middle panel: dependence of the
; middle panel: dependence of the ![]() /
/![]() ratio on the output spectral index,
ratio on the output spectral index, ![]() ; and right panel: dependence of the percentage of upper limits below 1 GHz on
; and right panel: dependence of the percentage of upper limits below 1 GHz on ![]() . The solid lines show the means derived for different bins in the x-axes of their respective plot, while the colored intervals show the 1σ interval for the same bins. The red point shows the values of spectral index α1 before and after correction, and the percentage of upper limits below 1 GHz, as presented in Sect. 5. The dashed lines are the equality lines.
. The solid lines show the means derived for different bins in the x-axes of their respective plot, while the colored intervals show the 1σ interval for the same bins. The red point shows the values of spectral index α1 before and after correction, and the percentage of upper limits below 1 GHz, as presented in Sect. 5. The dashed lines are the equality lines.
Current usage metrics show cumulative count of Article Views (full-text article views including HTML views, PDF and ePub downloads, according to the available data) and Abstracts Views on Vision4Press platform.
Data correspond to usage on the plateform after 2015. The current usage metrics is available 48-96 hours after online publication and is updated daily on week days.
Initial download of the metrics may take a while.