Free Access
Fig. 2.
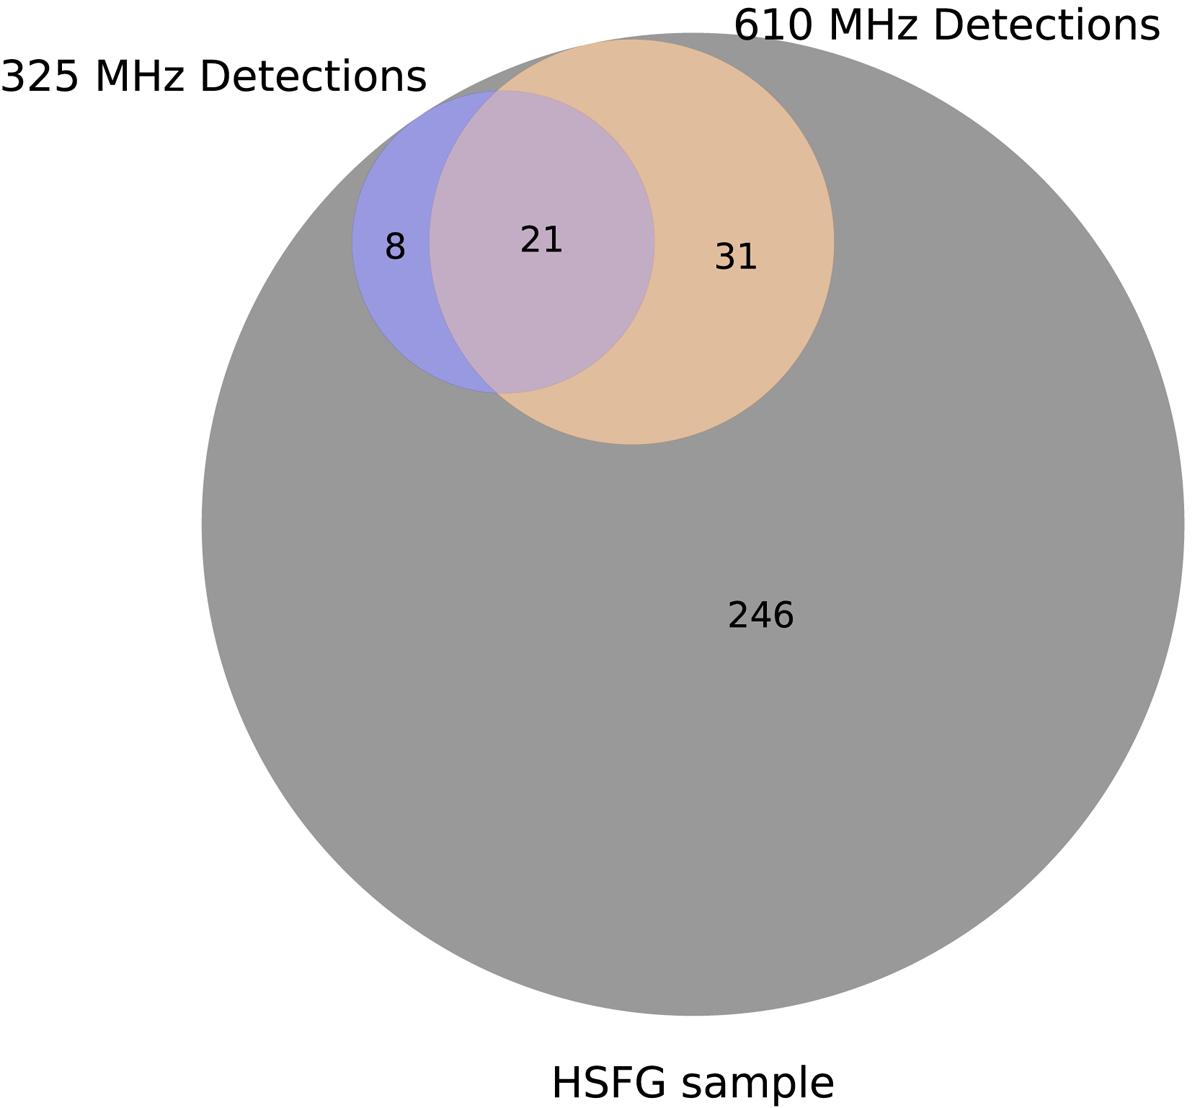
Number of detections in GMRT catalogs of sources in the HSFG samples. The gray area represents the sources that are not detected in the GMRT maps, while blue and orange areas represent sources detected at 325 MHz and 610 MHz, respectively.
Current usage metrics show cumulative count of Article Views (full-text article views including HTML views, PDF and ePub downloads, according to the available data) and Abstracts Views on Vision4Press platform.
Data correspond to usage on the plateform after 2015. The current usage metrics is available 48-96 hours after online publication and is updated daily on week days.
Initial download of the metrics may take a while.