Fig. A.2.
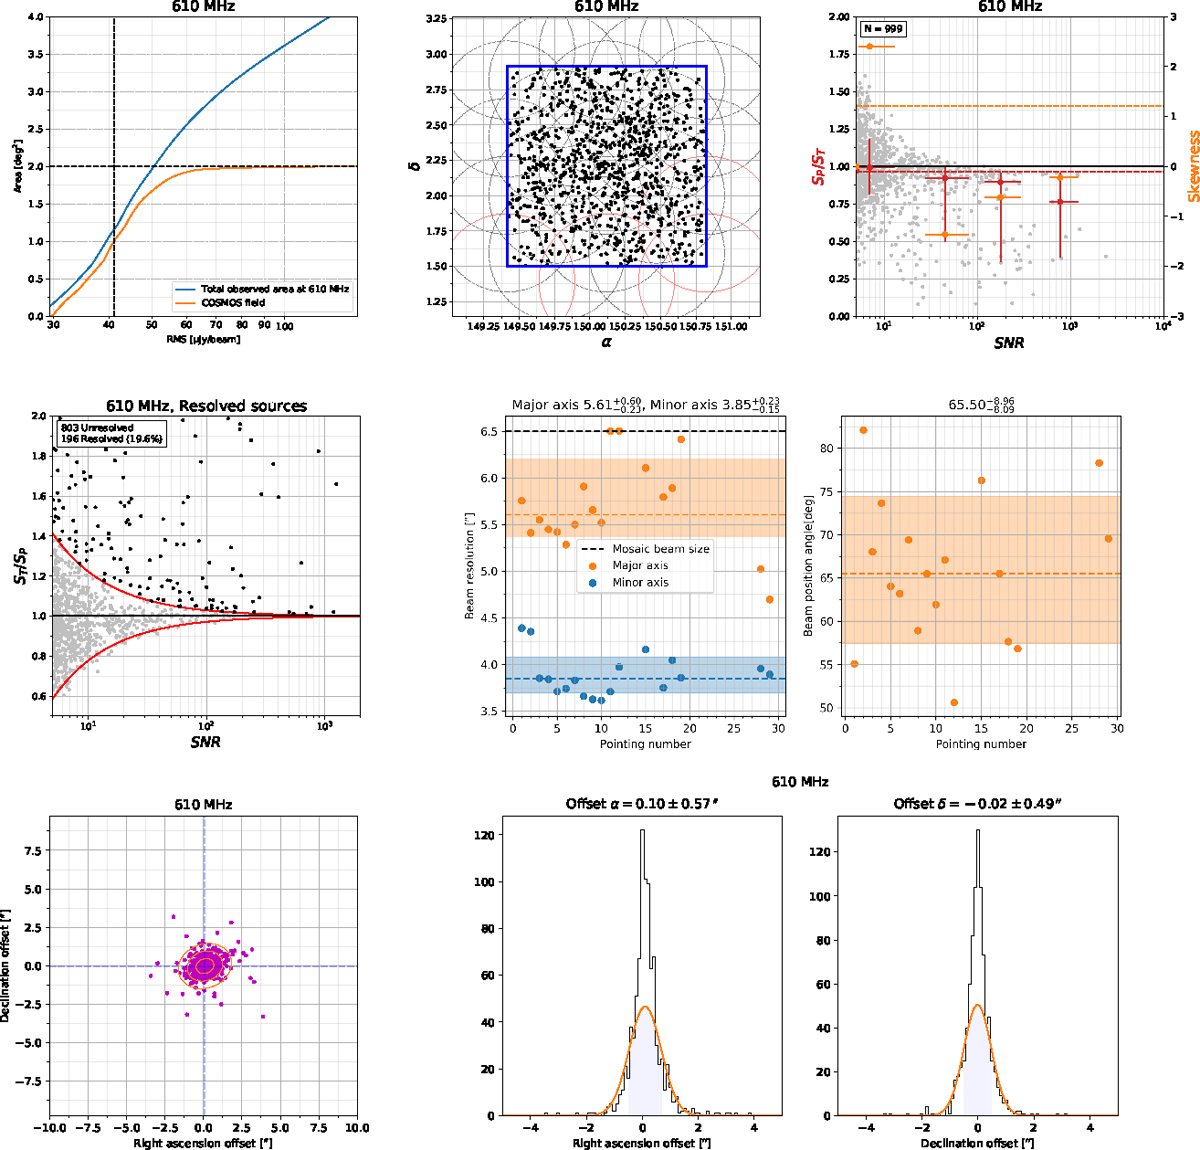
Top row: left panel: visibility function for the entire 610 MHz map (blue line) and the 2deg2 COSMOS field (orange line). The median rms within the COSMOS field is denoted by the black dashed line. Middle panel: positions of sources detected using blobcat in the 610 MHz mosaic. The blue rectangle shows the COSMOS field. Black dashed lines show the areas covered by individual pointings, while the red dashed lines show pointings that were excluded from the analysis. Right panel: peak-over-total flux ratio, SP/ST, as a function of the S/N for the 610 MHz map with sources extracted using blobcat. Red dots show the medians of SP/ST for different S/N bins, with 1σ percentiles as error bars. The red dashed line shows the median SP/ST of all the data points, while the orange dashed lines shows the overall skewness in this dataset. Middle row: left panel: total-over-peak flux ratio, ST/SP, as a function of the S/N for the 610 MHz map after bandwidth smearing correction. The red line shows the fit used to discern resolved sources. Middle and right panels: beam major and minor axes and the beam position angle for the GMRT 610 MHz pointings. The 1σ intervals for the respective beam parameters are shown as colored regions, with dashed lines showing their medians. Bottom row: astrometric offsets of the 610 MHz mosaic positions to the 3 GHz catalog. Left panel: two-dimensional distribution of offsets. Dashed blue lines indicate the median offset in right ascension and declination, and the blue shaded region shows the 1, 2, and 3σ covariance ellipses. Middle and right panels: their respective right ascension and declination offset histograms with fitted Gaussians.
Current usage metrics show cumulative count of Article Views (full-text article views including HTML views, PDF and ePub downloads, according to the available data) and Abstracts Views on Vision4Press platform.
Data correspond to usage on the plateform after 2015. The current usage metrics is available 48-96 hours after online publication and is updated daily on week days.
Initial download of the metrics may take a while.