Fig. 10.
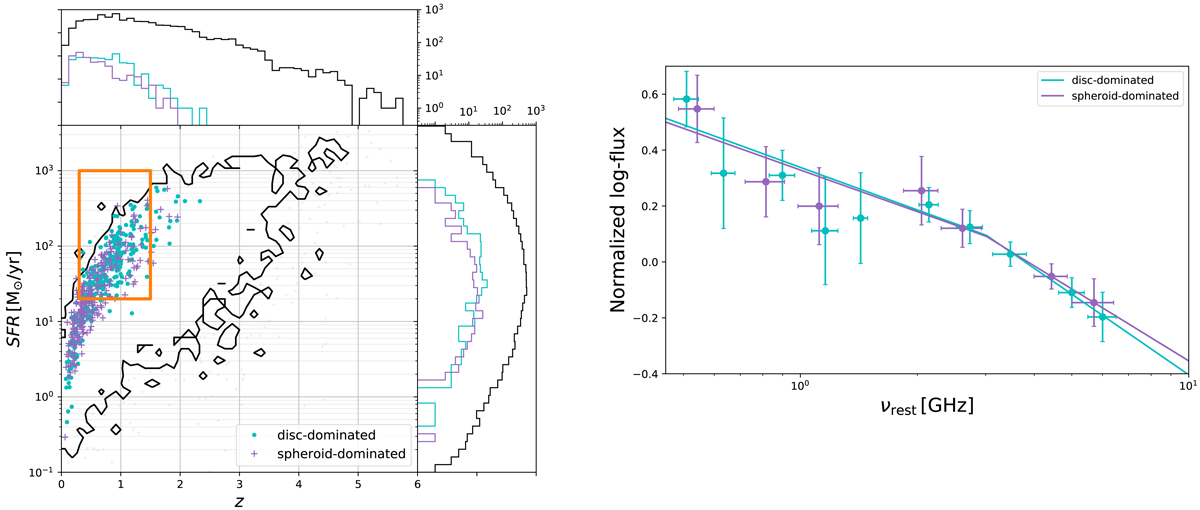
Left panel: distribution of sources in the SFR − z plane, analogous to Fig. 1. Cyan points and magenta crosses indicate the distributions of disk- and spheroid-dominated subsamples of star-forming galaxies, as defined in Molnár et al. (2018). The 3σ contours of the CSFG sample are shown as black lines, and the orange rectangle marks the edges of the chosen nearly complete disk- and spheroid-dominated samples. Right panel: their respective SEDs.
Current usage metrics show cumulative count of Article Views (full-text article views including HTML views, PDF and ePub downloads, according to the available data) and Abstracts Views on Vision4Press platform.
Data correspond to usage on the plateform after 2015. The current usage metrics is available 48-96 hours after online publication and is updated daily on week days.
Initial download of the metrics may take a while.