Fig. 1.
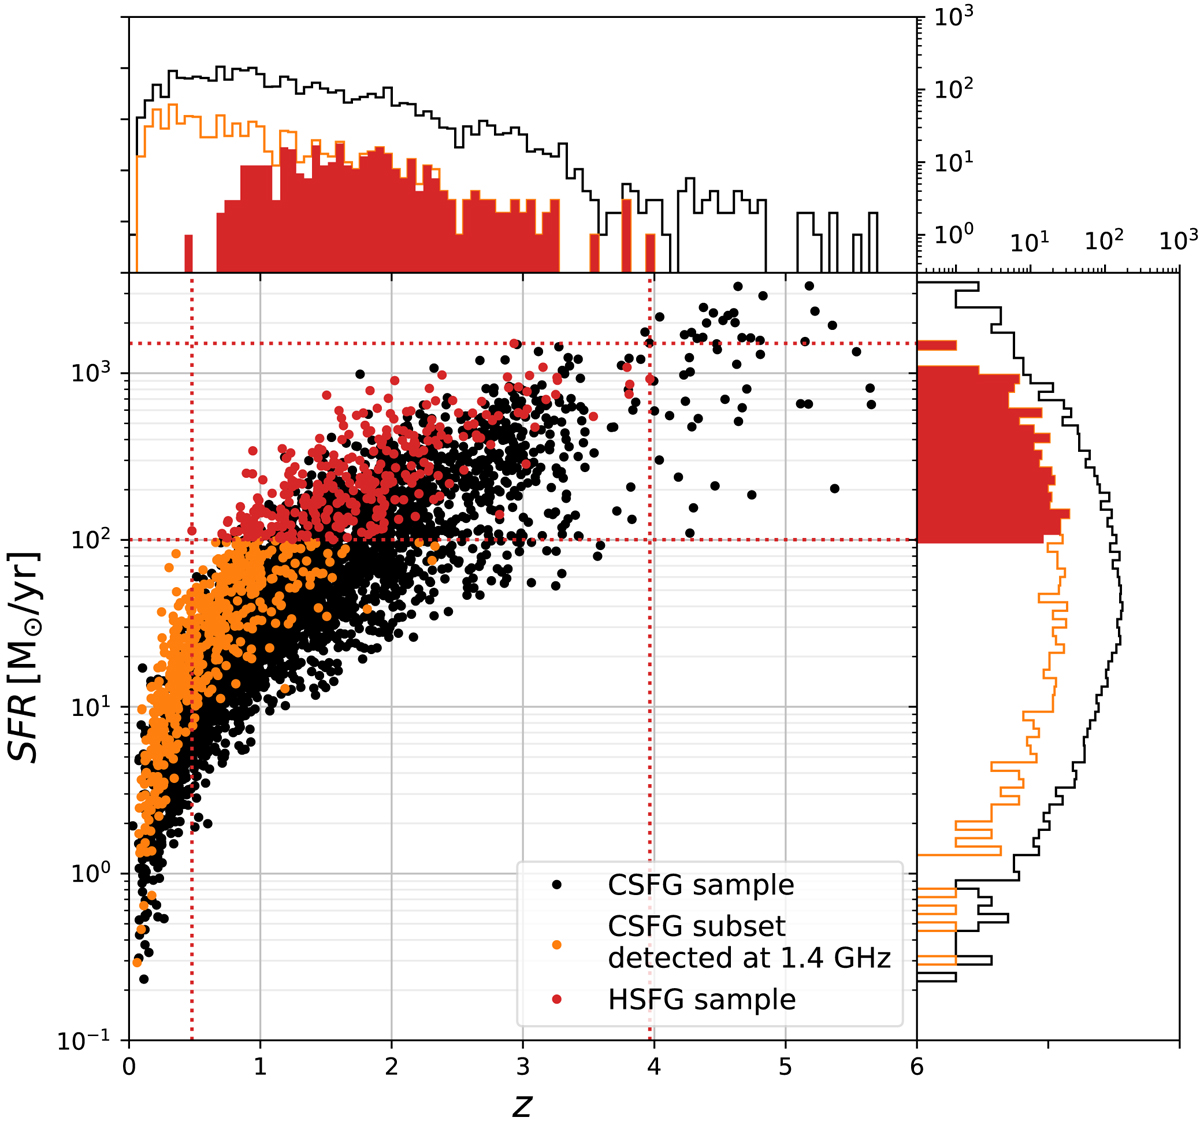
Star formation rate vs. redshift for the “clean star-forming galaxy sample” (CSFG, black points), as defined by Smolčić et al. (2017b), and described in Sect. 3. Orange points indicate a subset of the CSFG sample that was detected at both 1.4 GHz and 3 GHz. Red points indicate the HSFG sample used here, i.e., the subset of the CSFG sample with an additional cut of the infrared-derived SFR, SFR > 100 M⊙ yr−1. Histograms show the redshift and SFR distributions with the different subsamples colored as in the main figure. For greater clarity, the HSFG sample is marked by filled histograms, and its limits in the main figure are denoted by dotted red lines.
Current usage metrics show cumulative count of Article Views (full-text article views including HTML views, PDF and ePub downloads, according to the available data) and Abstracts Views on Vision4Press platform.
Data correspond to usage on the plateform after 2015. The current usage metrics is available 48-96 hours after online publication and is updated daily on week days.
Initial download of the metrics may take a while.