Fig. 8
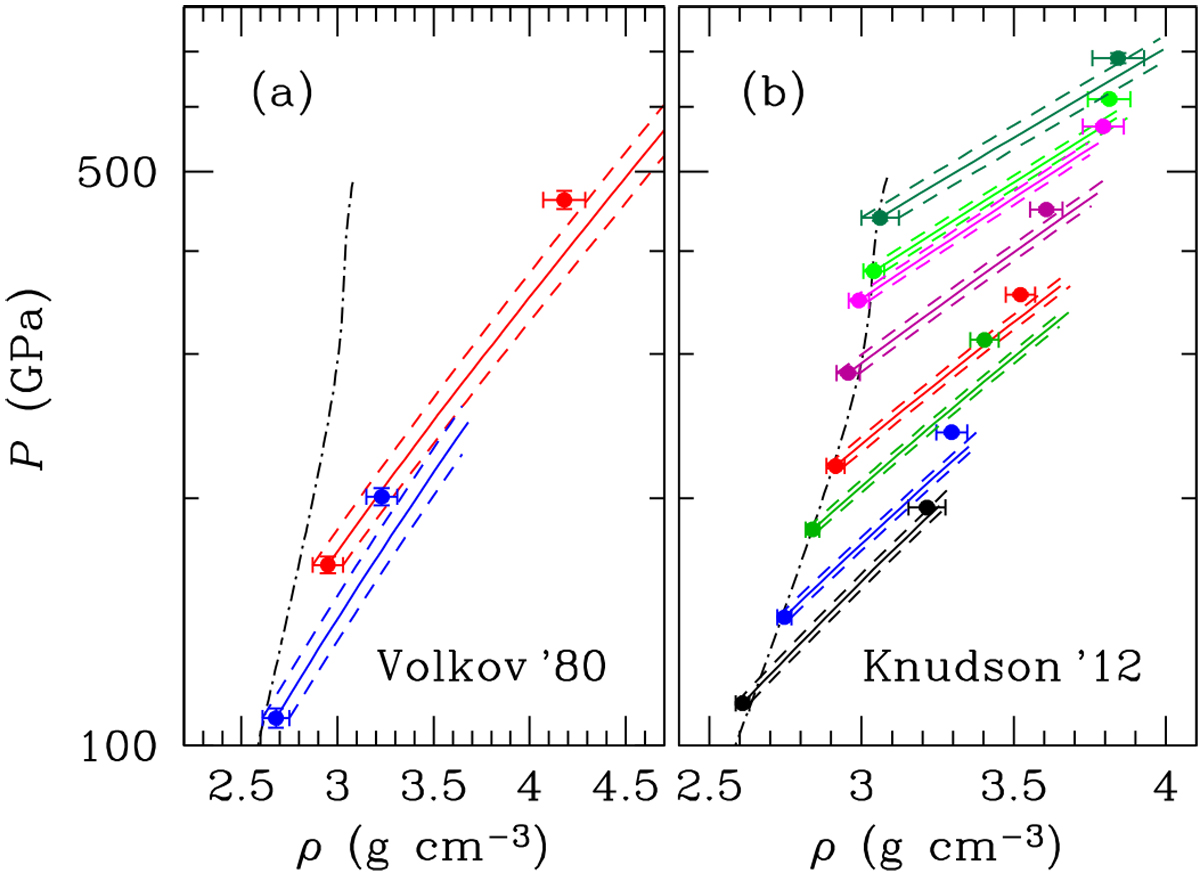
Comparison of experimental data for reshocked water (points with error bars) with corresponding Hugoniot lines calculated from the analytical fit (solid lines). The principal Hugoniot is shown by the dot-dashed line. Dashed lines show the theoretical regions defined by taking into account 1σ experimental uncertainties for the initial (primary-shock) states. Panels a and b: comparison for the data of Volkov et al. (1980) and of Knudson et al. (2012), respectively.
Current usage metrics show cumulative count of Article Views (full-text article views including HTML views, PDF and ePub downloads, according to the available data) and Abstracts Views on Vision4Press platform.
Data correspond to usage on the plateform after 2015. The current usage metrics is available 48-96 hours after online publication and is updated daily on week days.
Initial download of the metrics may take a while.