Fig. 7
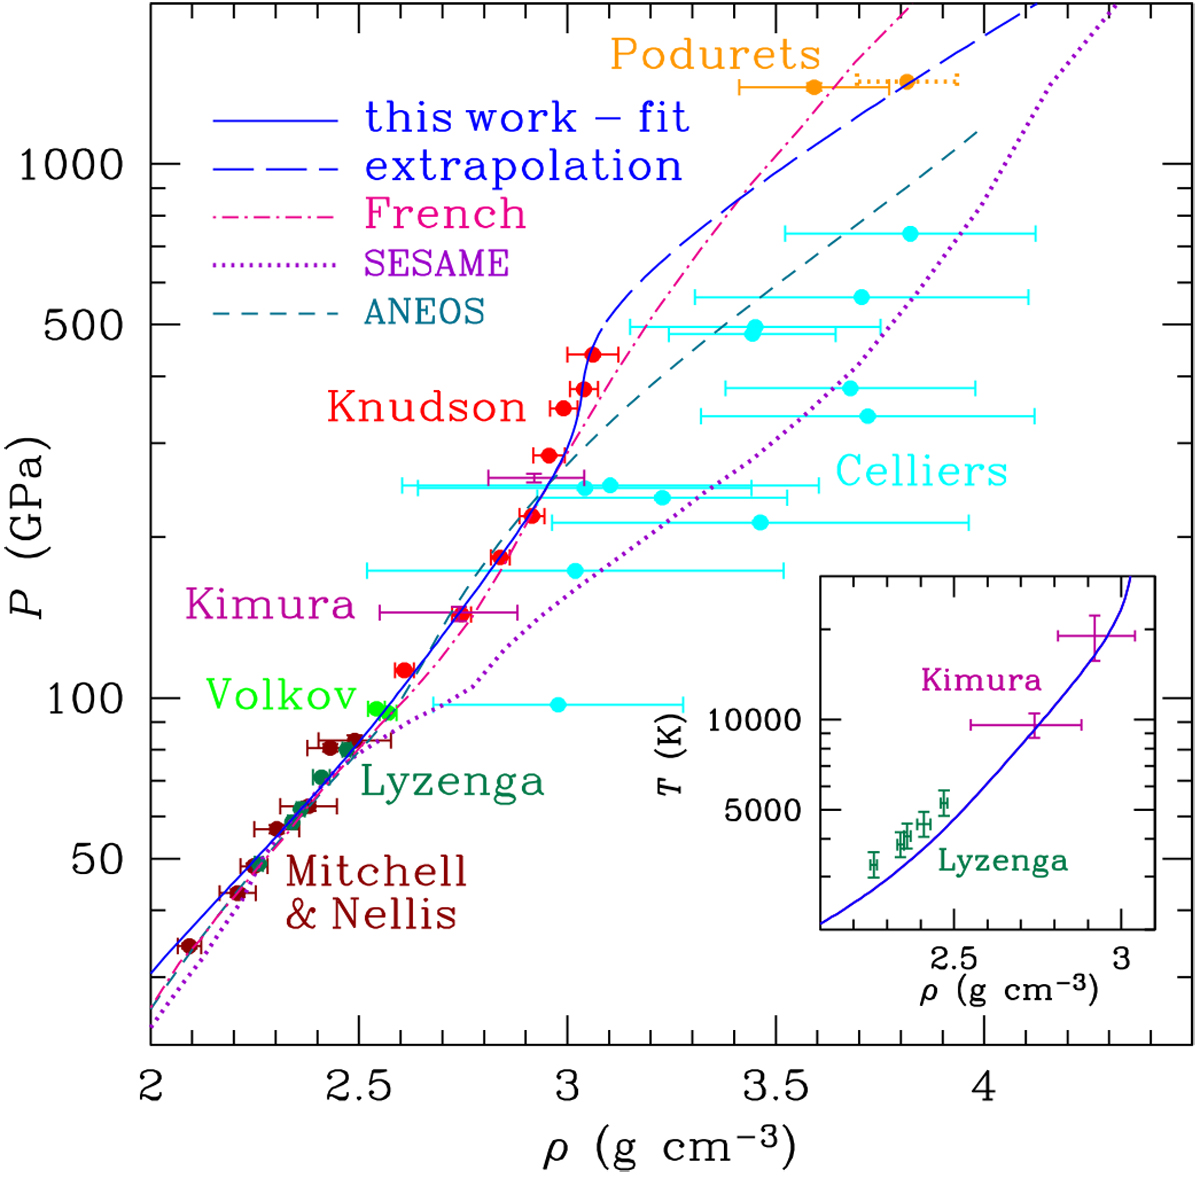
Principal Hugoniot line in the ρ–P plane calculated using the present fit (solid line for T < 50 000 K, continued bylong-dashed line for T > 50 000 K) compared with experimental data (dots with error bars) of Podurets et al. (1972; as reanalyzed by Knudson et al. 2012; the original result of Podurets et al. 1972 is also shown with dotted error bars), Volkov et al. (1980); Mitchell & Nellis (1982); Lyzenga et al. (1982); Celliers et al. (2004); Knudson et al. (2012), and Kimura et al. (2015). For comparison, the principal Hugoniot lines predicted by the SESAME (Lyon & Johnson 1992) and ANEOS (Thomson & Lauson 1972) models are shown by the dotted line and short-dashed line, respectively. Inset panel: principal Hugoniot line in the ρ– T plane calculated from the fit and the experimental data points from Lyzenga et al. (1982) and Kimura et al. (2015).
Current usage metrics show cumulative count of Article Views (full-text article views including HTML views, PDF and ePub downloads, according to the available data) and Abstracts Views on Vision4Press platform.
Data correspond to usage on the plateform after 2015. The current usage metrics is available 48-96 hours after online publication and is updated daily on week days.
Initial download of the metrics may take a while.