Fig. 5
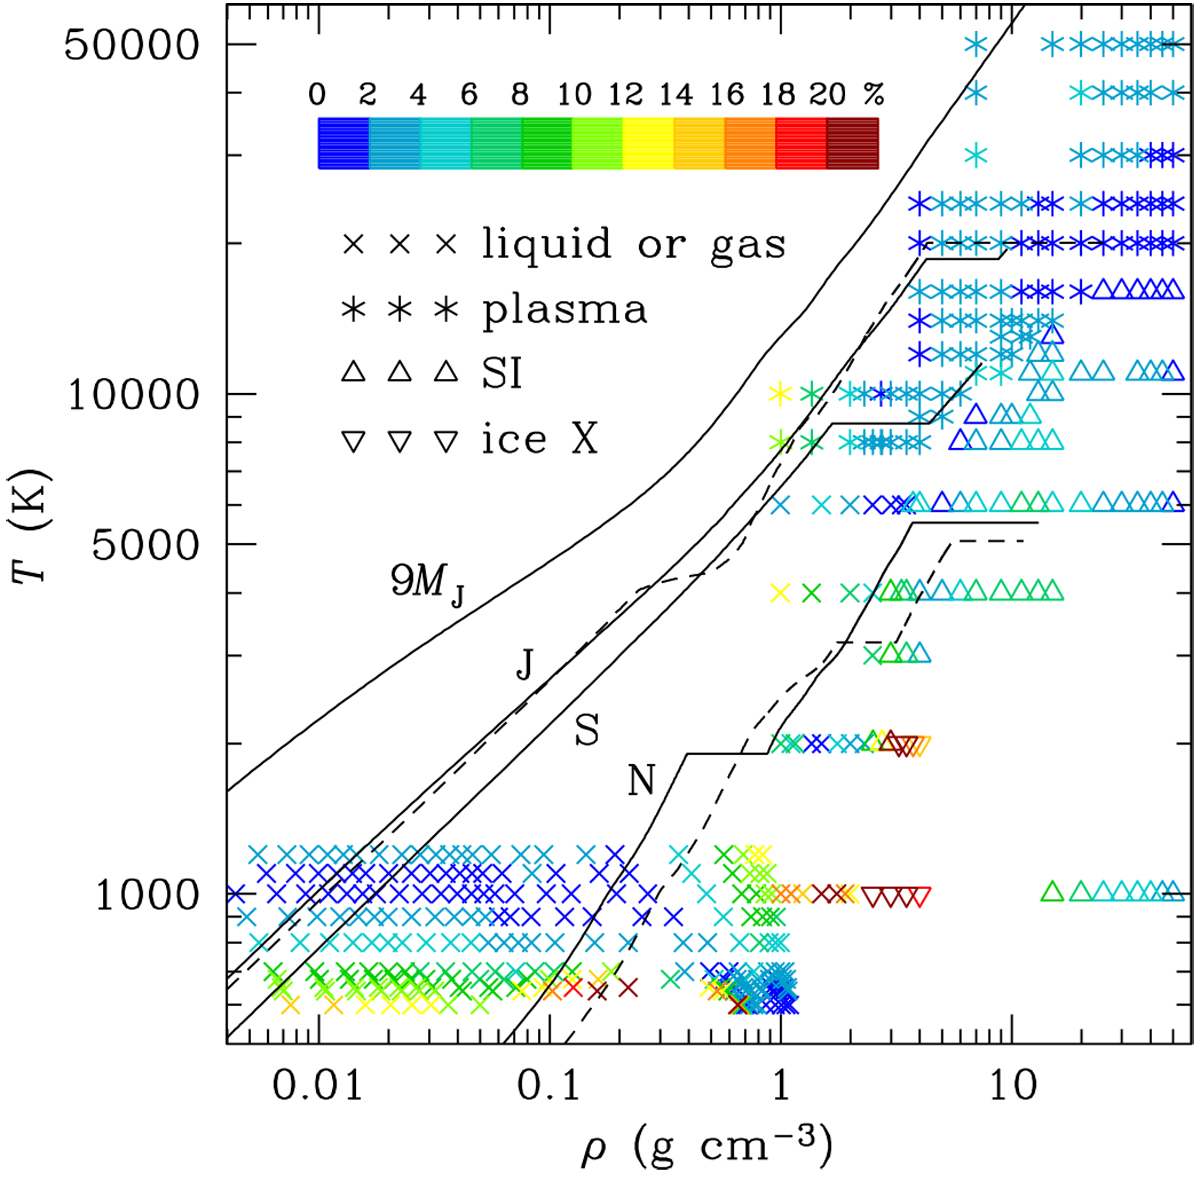
Pointsin the ρ–T plane where the input data have been used to construct the analytical fit. Different symbols correspond to different phase states: crosses for liquid, asterisks for plasma, upright triangles for superionic state, and reverted triangles for ice X. The colors of the symbols represent the accuracy of the fit (for both P and U, i.e., the maximum of the two residuals) according to the palette above the legend. The lines show isentropes of Jupiter (J), according to the models of Leconte & Chabrier (2012) and Nettelmann et al. (2012; the solid and dashed lines, respectively), Saturn (S), according to Leconte & Chabrier (2012), Neptune (N) according to two models of Nettelmann et al. (2013; solid and dashed lines), and a planet with M = 9 MJ (see Baraffe et al. 2008, 2010).
Current usage metrics show cumulative count of Article Views (full-text article views including HTML views, PDF and ePub downloads, according to the available data) and Abstracts Views on Vision4Press platform.
Data correspond to usage on the plateform after 2015. The current usage metrics is available 48-96 hours after online publication and is updated daily on week days.
Initial download of the metrics may take a while.