Fig. 3
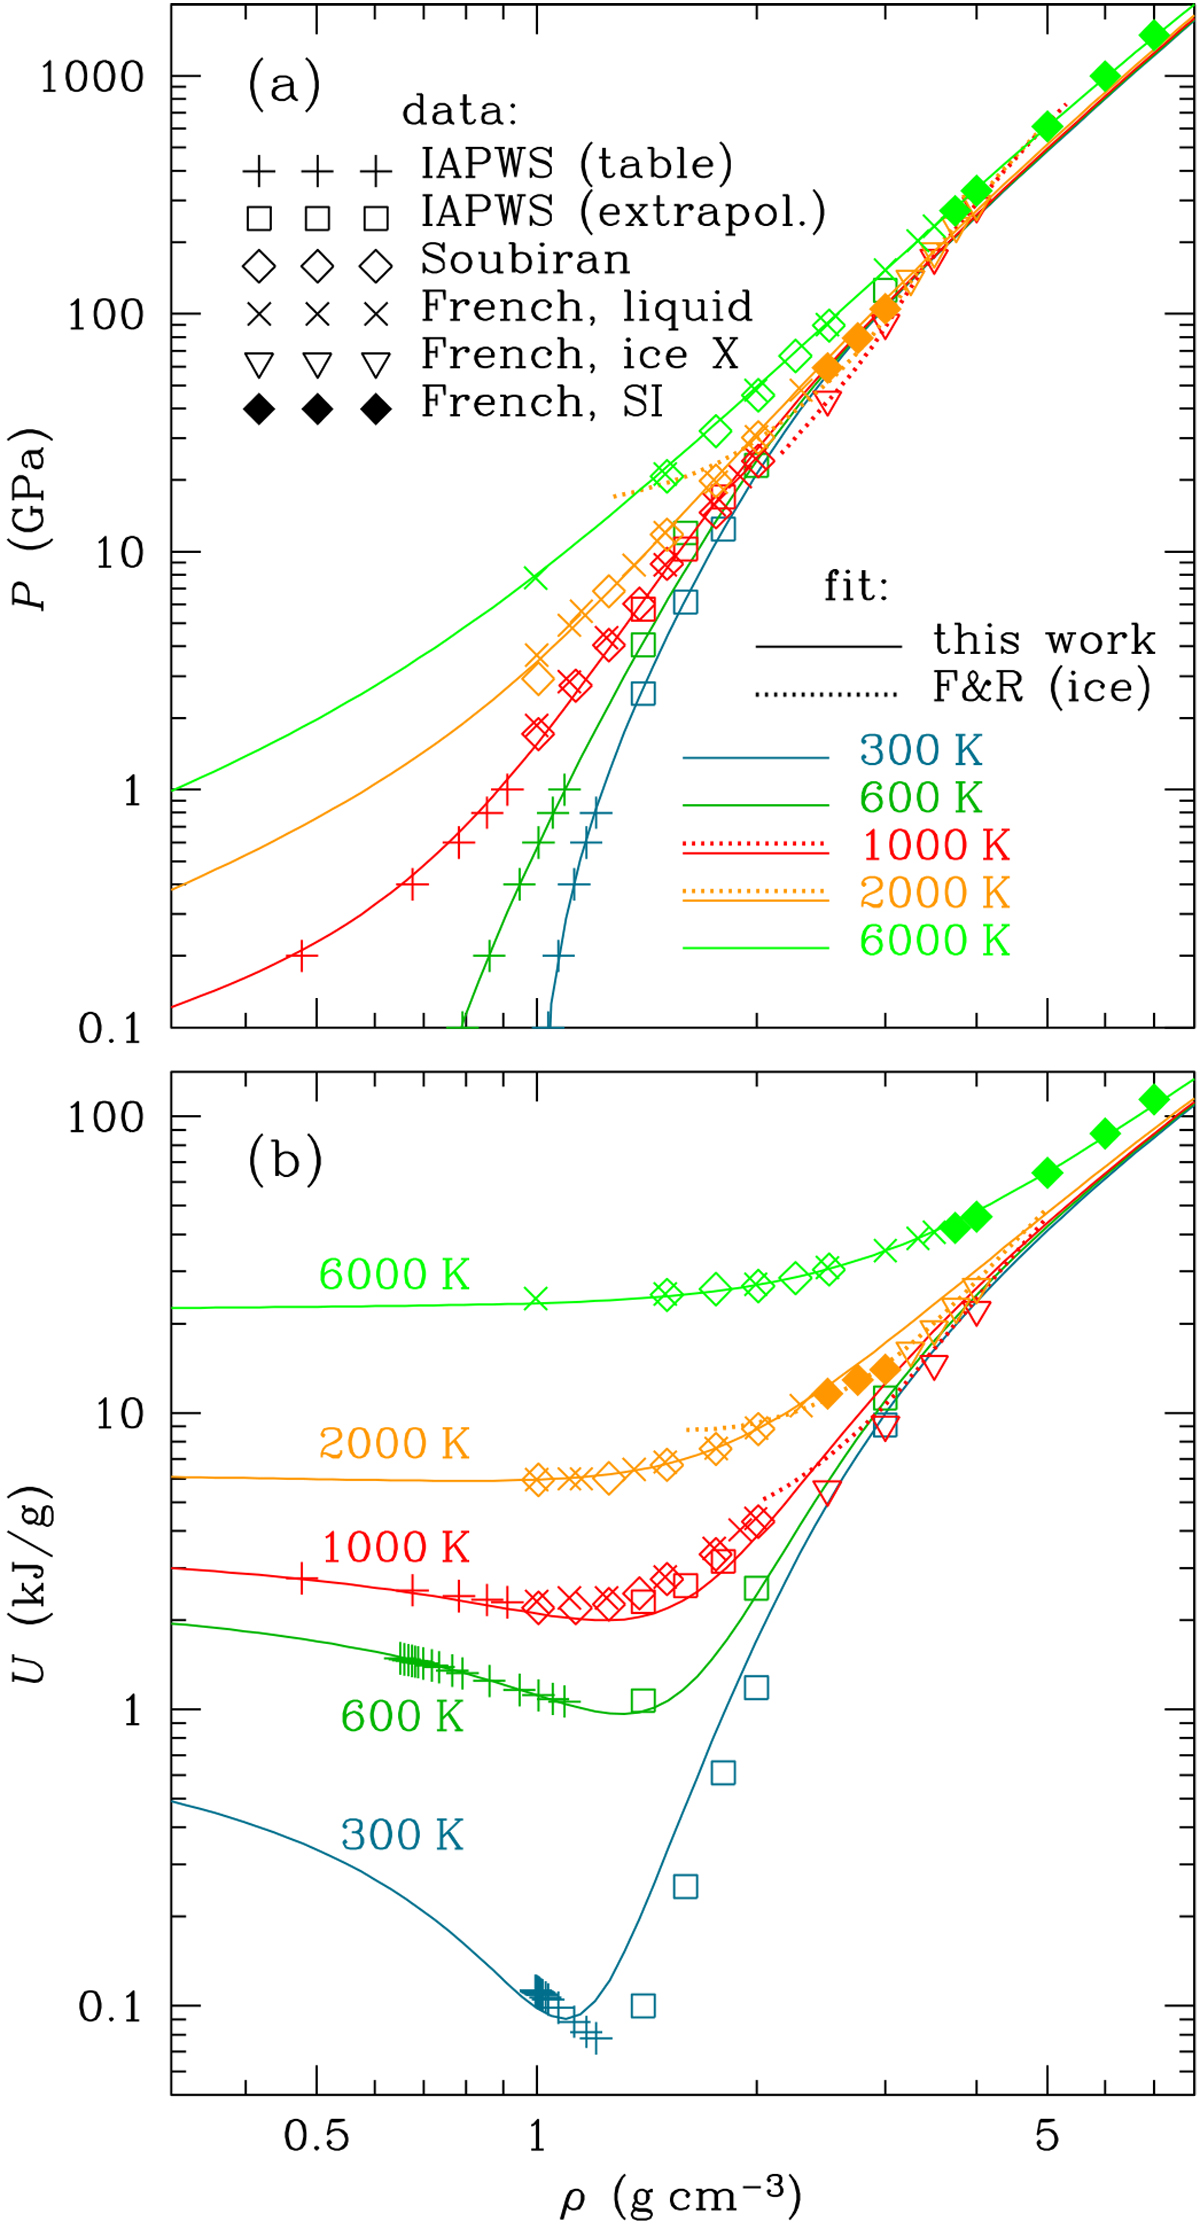
Comparison between the input data and the analytical fitted isotherms for the pressure P (panel a) and for the internal energy U (panel b) atrelatively low densities. Symbols show the data: the IAPWS (Wagner & Pruß 2002) published table for P < 1 GPa (straight crosses) and extension to P > 1 GPa according to the IAPWS free-energy model (squares); results of ab initio calculations by Soubiran & Militzer (2015; empty diamonds) and by French et al. (2009; oblique crosses for liquid, inverted triangles for ice X, filled diamonds for the superionic [SI] phase). Solid lines represent the present fit; dotted lines represent the fit of French & Redmer (2015) for ice X.
Current usage metrics show cumulative count of Article Views (full-text article views including HTML views, PDF and ePub downloads, according to the available data) and Abstracts Views on Vision4Press platform.
Data correspond to usage on the plateform after 2015. The current usage metrics is available 48-96 hours after online publication and is updated daily on week days.
Initial download of the metrics may take a while.