Fig. 13
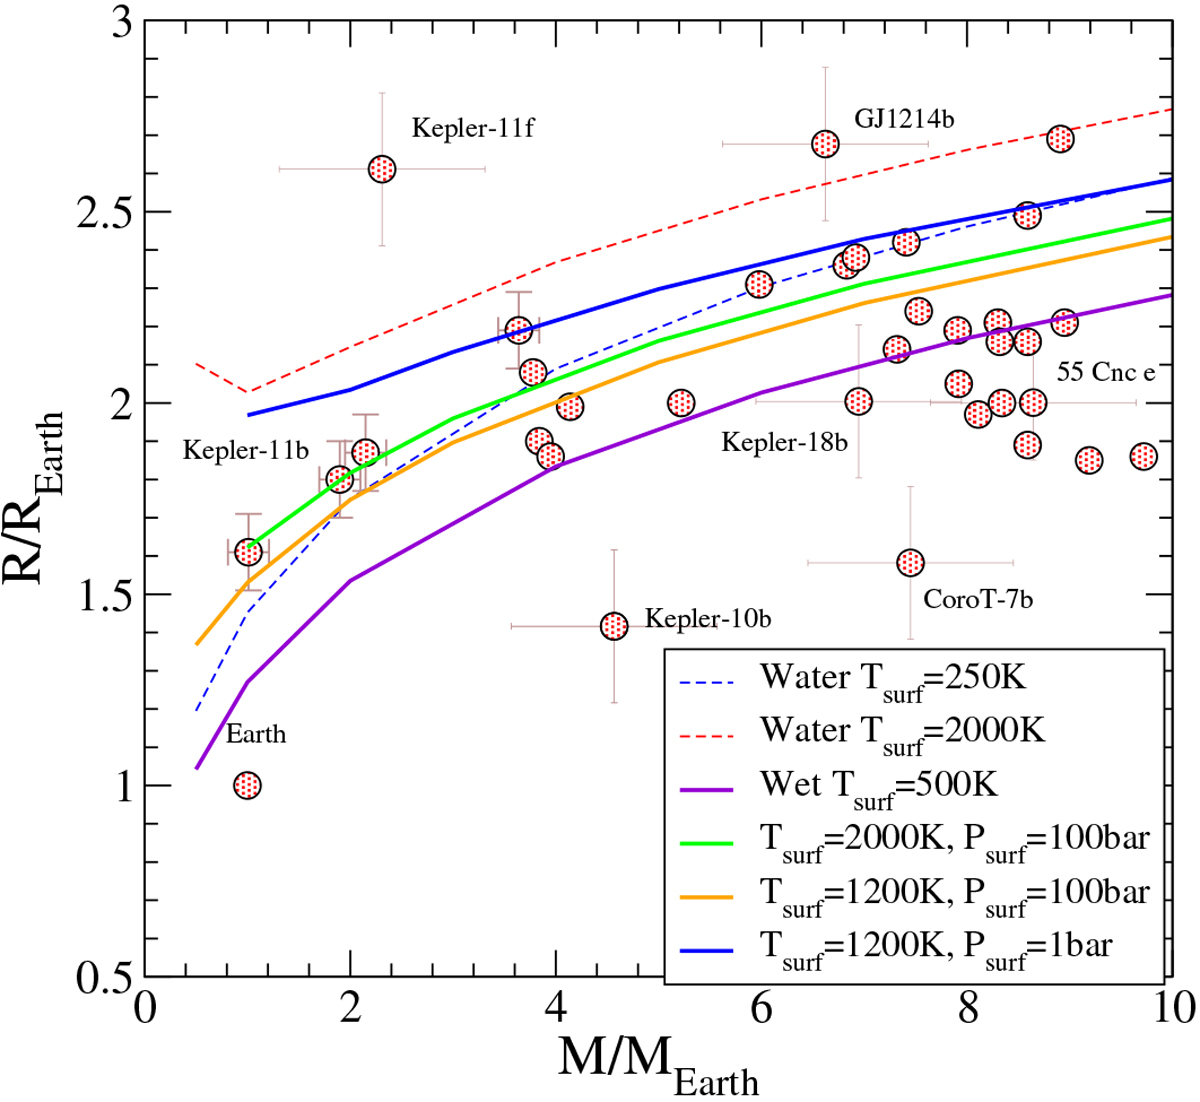
Temperature dependence of the mass–radius relationship for adiabatic models of wet super-Earth planets containing 50% water as solid lines. The surface temperatures and pressures are indicated in the figure. The dots represent detected planets in this range of planetary mass. The isothermal models for pure-water planets (dashed) and wet super-Earth planets (purple) with the corresponding surface temperatures are also displayed in the figure. These correspond to the data shown in Figs. 11 and 12, respectively.
Current usage metrics show cumulative count of Article Views (full-text article views including HTML views, PDF and ePub downloads, according to the available data) and Abstracts Views on Vision4Press platform.
Data correspond to usage on the plateform after 2015. The current usage metrics is available 48-96 hours after online publication and is updated daily on week days.
Initial download of the metrics may take a while.