Fig. 16
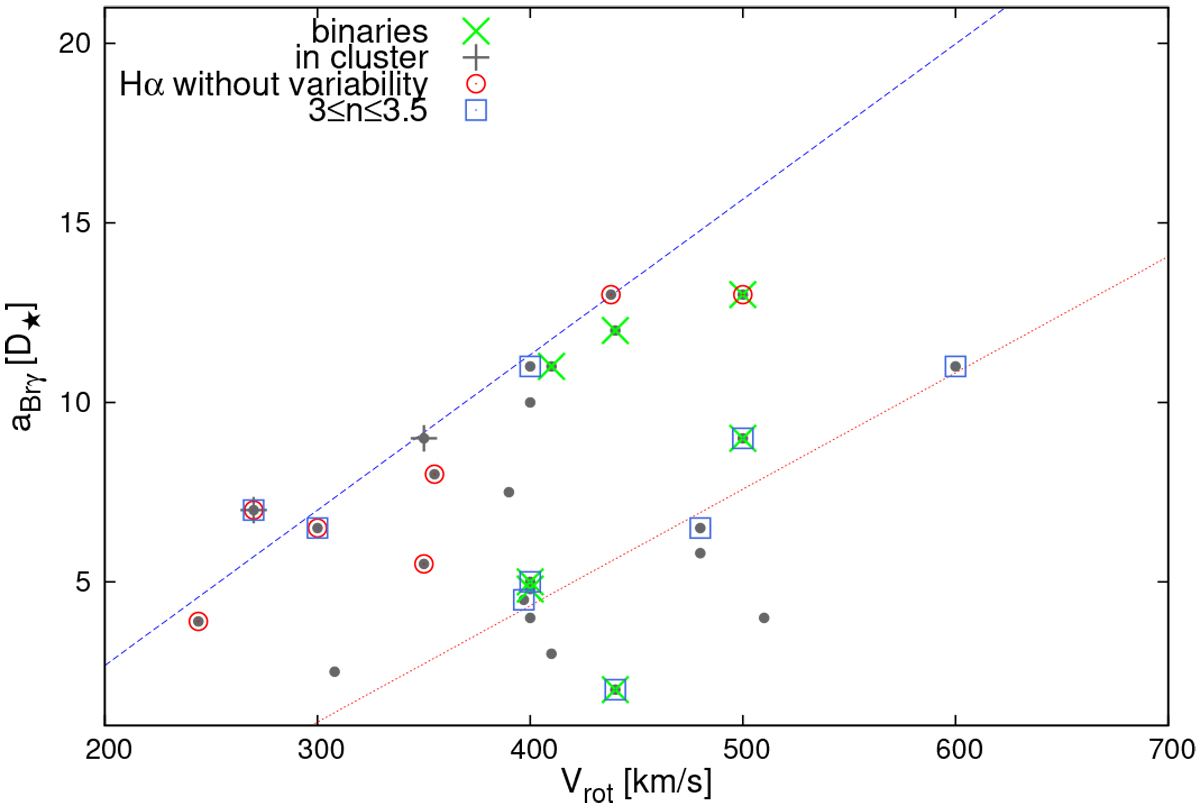
Relation between Vrot and the diskextension in the line for the star sample (black dots) included in this work and Meilland et al. (2012). The colored linessymbols are given in the top left of the figure. The blue dashed line from Fig. 15 could state an upper limit for the disk size of the stars indicated as “without variability”. The orange dotted line seems to oultine a second linear regretion from stars with stable disks.
Current usage metrics show cumulative count of Article Views (full-text article views including HTML views, PDF and ePub downloads, according to the available data) and Abstracts Views on Vision4Press platform.
Data correspond to usage on the plateform after 2015. The current usage metrics is available 48-96 hours after online publication and is updated daily on week days.
Initial download of the metrics may take a while.